U.S. equities rose in 2023, with the mega-cap “Magnificent Seven” driving most of the S&P Composite 1500®’s 25% gain. While mega caps continued to outperform in January 2024, not all seven of the aforementioned group ranked highly. This has led to some market commentators looking to coin new phrases: “Sensational Six” or “Super Six” (the jury is still out on the new superhero-esque moniker, count and membership of our new set of mega caps).
Some market participants have sought to diversify their mega-cap exposure through the S&P 500® Equal Weight Index. Other smaller-size tools of diversification are the S&P MidCap 400® and the S&P SmallCap 600®, which have distinct characteristics and sector exposure from large caps.
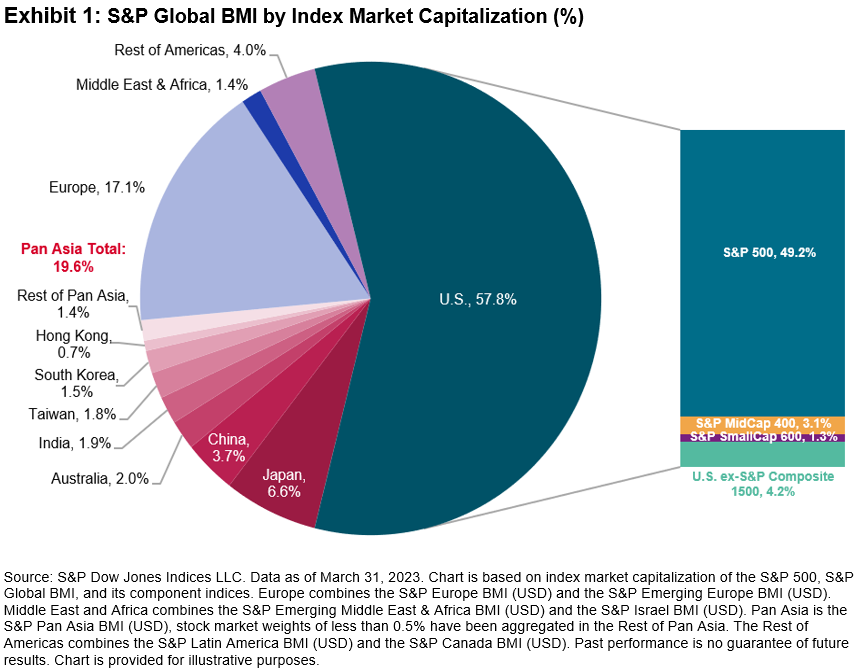
U.S. small and mid caps have benefited from the small- and mid-size equity premium historically, outperforming the S&P 500 over the long run. Historically, there has also been a cyclicality among U.S. equity size ranges. While the S&P 400® and S&P 600® are smaller than large-cap U.S. equities, when looking abroad, the U.S. mid-cap and small-cap markets are equivalent to entire countries’ entire equity markets. Exhibit 1 shows that the S&P 400 would rank as the fourth-largest country in the S&P Global BMI and the S&P 600 is larger than South Korea (all based on float-adjusted market capitalization).

Differences in sector exposure among the U.S. equity size segments have also meant that the S&P 400 and S&P 600 are more domestically focused than the S&P 500, with higher weights in Industrials, Financials, and Real Estate. This has historically meant greater sensitivity to U.S. macro indicators, such as GDP growth, than large-cap stocks.

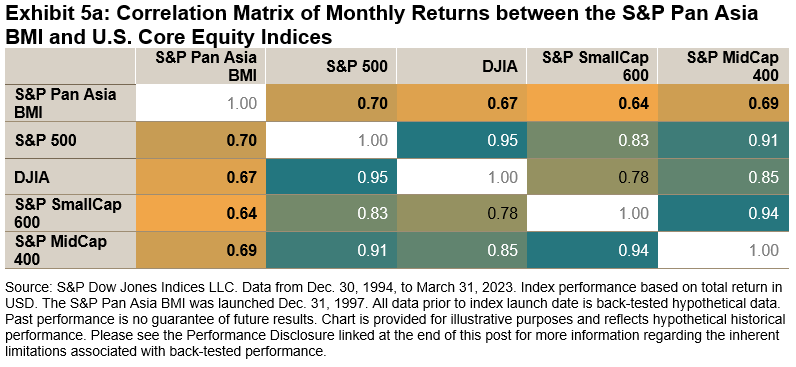
The differences in sector composition shown in Exhibit 2 in part help explain the non-perfect correlation (see Exhibit 3) between the S&P 500 and smaller-size-focused U.S. equity indices. These differences in sectors and correlation may present an interesting option to diversify with the S&P MidCap 400 and the S&P SmallCap 600, with a potential to reduce risk-adjusted return compared with the S&P 500 alone.

Interest rates may provide a tactical opportunity to diversify the large-cap S&P 500 with the S&P 500 Equal Weight Index, S&P MidCap 400 and S&P SmallCap 600, based on their different relative responses to interest rates under different regimes. Looking at monthly data since December 1994, Exhibit 4 shows that the S&P 500 rose about 66% of the time, while U.S. Treasury rates fell about 49% of the time (almost a coin flip). Current market expectations are of falling rates and a positive market environment, which happened one-third of the time. 2022’s dynamic of a falling stock market and rising rates was rare, occurring in 15% of months.

Exhibit 5 shows the historical relationships between interest rates and market regimes and the performance of various U.S. equity size ranges relative to the S&P 500. A key observation is that the direction of the stock market mattered more than the direction of interest rates in driving relative performance: the average relative performance changed by greater amounts based on market direction than on rate changes. Exhibit 5 also shows that the S&P MidCap 400, S&P SmallCap 600 and S&P 500 Equal Weight Index tended to outperform the S&P 500 in months when both the S&P 500 was up and U.S. 10-Year Treasury yields rose. The indices tended to perform in line with the S&P 500 when the large-cap U.S. equity bellwether gained and the U.S. 10-Year Treasury was down.

Of course, it is difficult to predict the direction of interest rates, the stock market, or both. But the historical performance of smaller U.S. size segments, their distinct characteristics and their sheer size mean that market participants may wish to consider the S&P 400 and S&P 600 as additional tools in their U.S. equity choices.






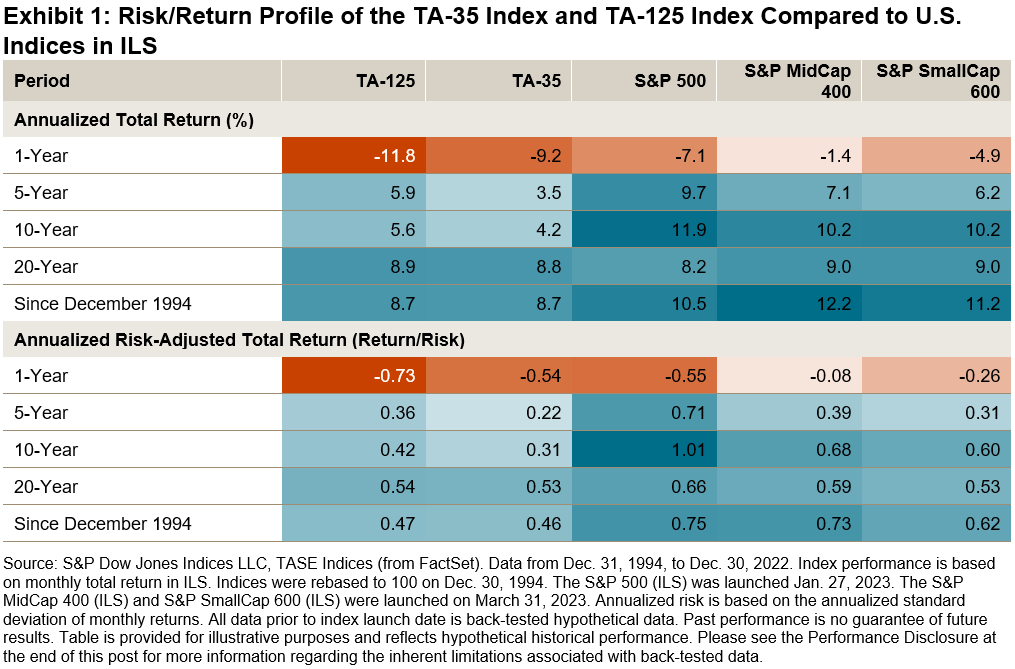
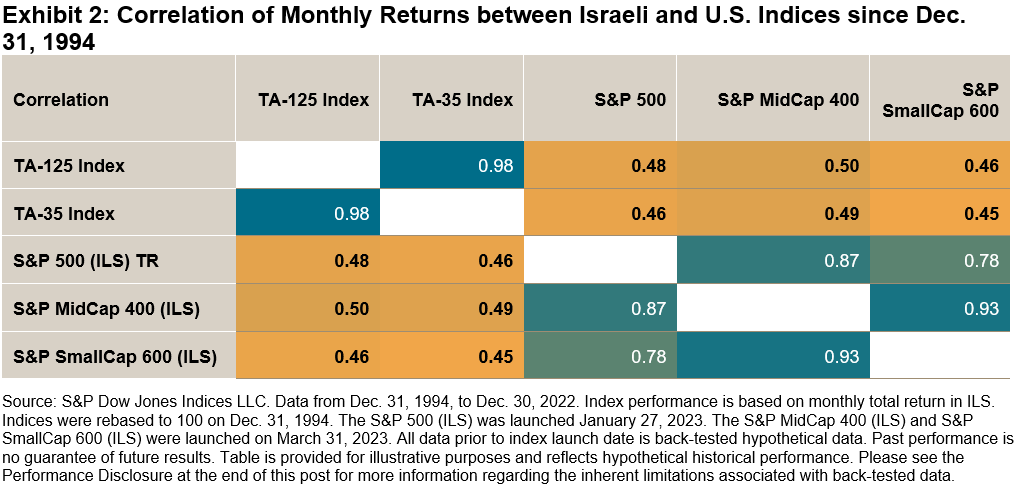


 In addition to the potential performance and diversification benefits, incorporating U.S. equities may help Israeli investors to alleviate domestic sector biases. Compared to the S&P 500, Israeli equity indices like the TA-125 and TA-35 are heavily overweight Financials and Real Estate, while underweighting Information Technology by 11%, as shown in Exhibit 4b. The S&P 500’s largest constituents include some of the world’s most well-known “big tech” companies, such as Apple and Microsoft.


