Get Indexology® Blog updates via email.

In This List

An Israeli Home with a U.S. Twist

SPIVA Japan Scorecard 2022: Active Underperformance Despite an Abundance of Opportunities

Examining Passive Performance at the Core

Diversification and Performance: Potential Applications of U.S. Equities in Japan

The “Devil’s Metal” Vanishes, Precious Metals Shine and Energy Dims: Commodities Quarterly Wrap

An Israeli Home with a U.S. Twist

Contributor Image
Sherifa Issifu

Senior Analyst, U.S. Equity Indices

S&P Dow Jones Indices

Our new research paper shows that Israeli investors have a greater home bias than other nations: they have invested more heavily in domestic equities and allocated to the U.S. in lower proportions than their developed markets peers such as the U.K., Europe and Canada. With U.S. equities making up nearly 60% of the S&P Global BMI’s market capitalization, such allocations may be overlooking a sizeable portion of the global equity opportunity set. Adding some U.S. decor to a domestic Israeli equity allocation also historically provided higher return in both absolute and risk-adjusted terms, and could offer the potential for diversification.

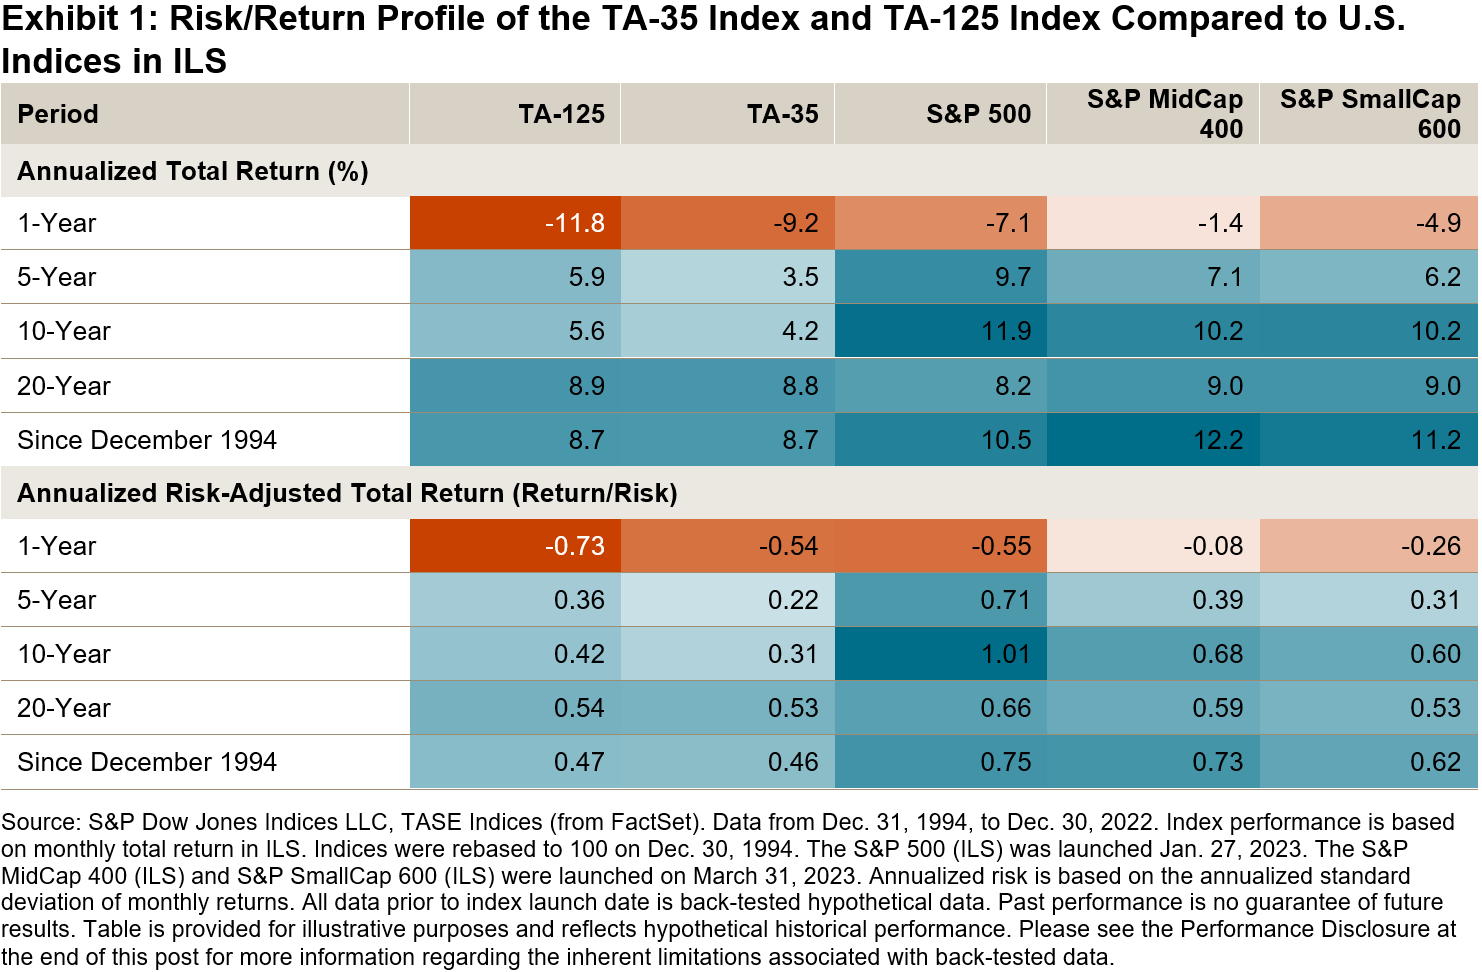
U.S. Equities Have Outperformed Their Israeli Counterparts over Various Horizons

The S&P 500®, S&P MidCap 400® and S&P SmallCap 600® outperformed the Israeli equity market—as represented by the TA-125—by 15%, 11% and 9%, respectively, in Q1 2023 (all in ILS and total return terms). Exhibit 1 shows that this phenomenon is not just a recent one: U.S. equities have outperformed their Israeli counterparts over short-, medium- and long-term horizons in both absolute and risk-adjusted terms. Similar results are observed for USD-denominated versions of the indices.

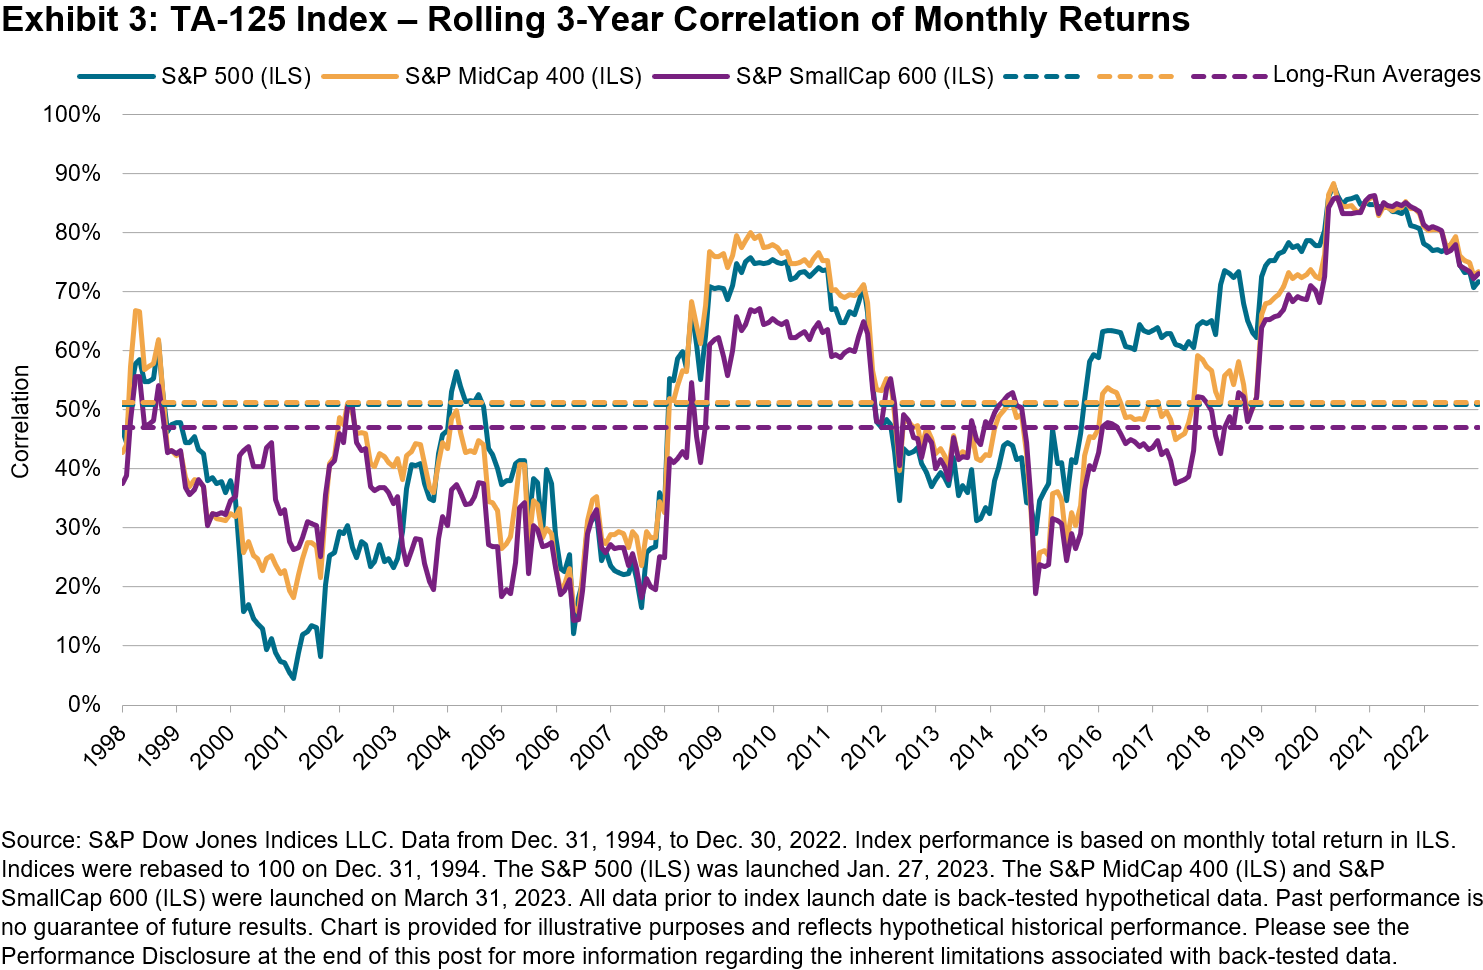
Looking at the correlation of U.S. equities with the TA-125 and blue-chip TA-35 in Exhibit 2 we can see that all of the S&P Composite 1500®’s component indices had a correlation of less than 0.5 (based on monthly returns since Dec. 31, 1994). This suggests an opportunity for U.S. equities to act as a diversifier when incorporated into Israeli equity allocations.

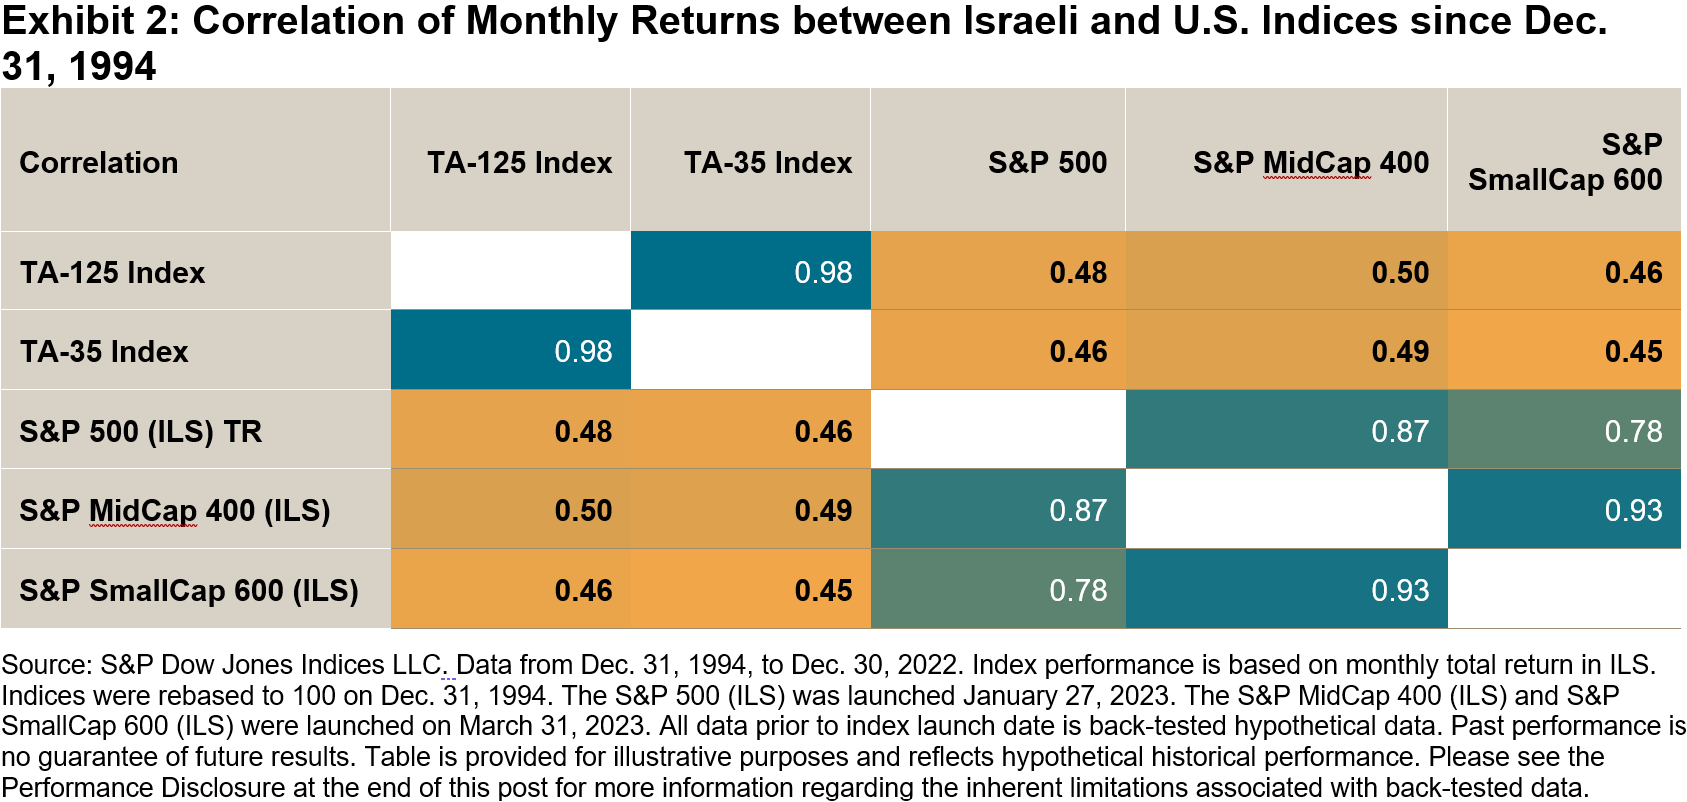
Despite recent spikes in 3-year rolling correlation, compared to correlations over the last 28 years, U.S. and Israeli equities are not perfectly correlated (equal to 1), which means there is still opportunity for diversification. In recent times, that opportunity has increased, with U.S. and Israeli equities continuing to decouple from their 2020 coronavirus correlation highs.

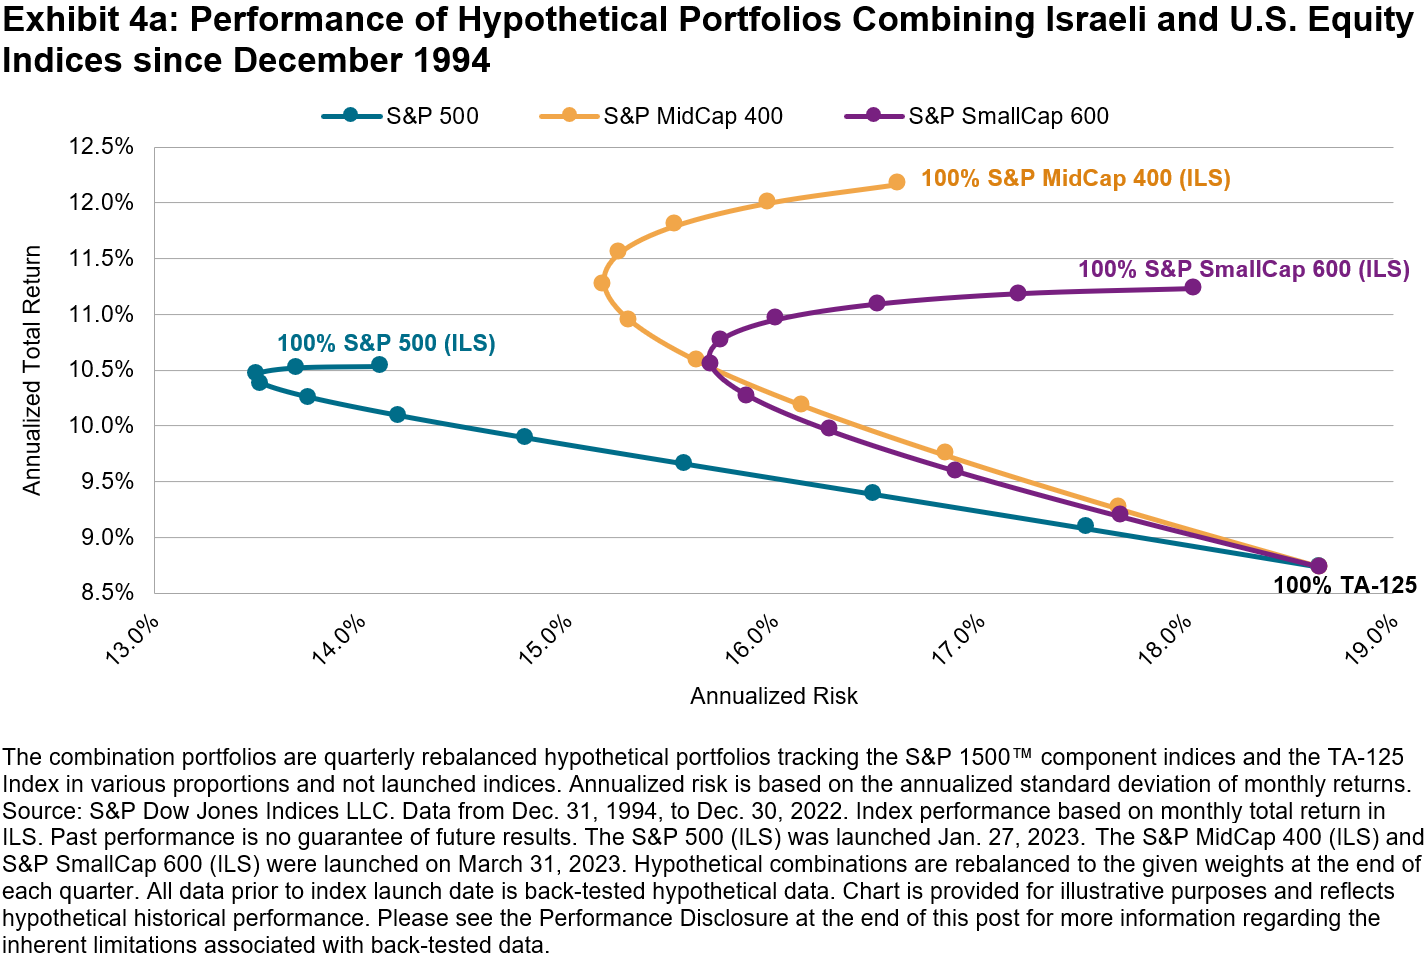
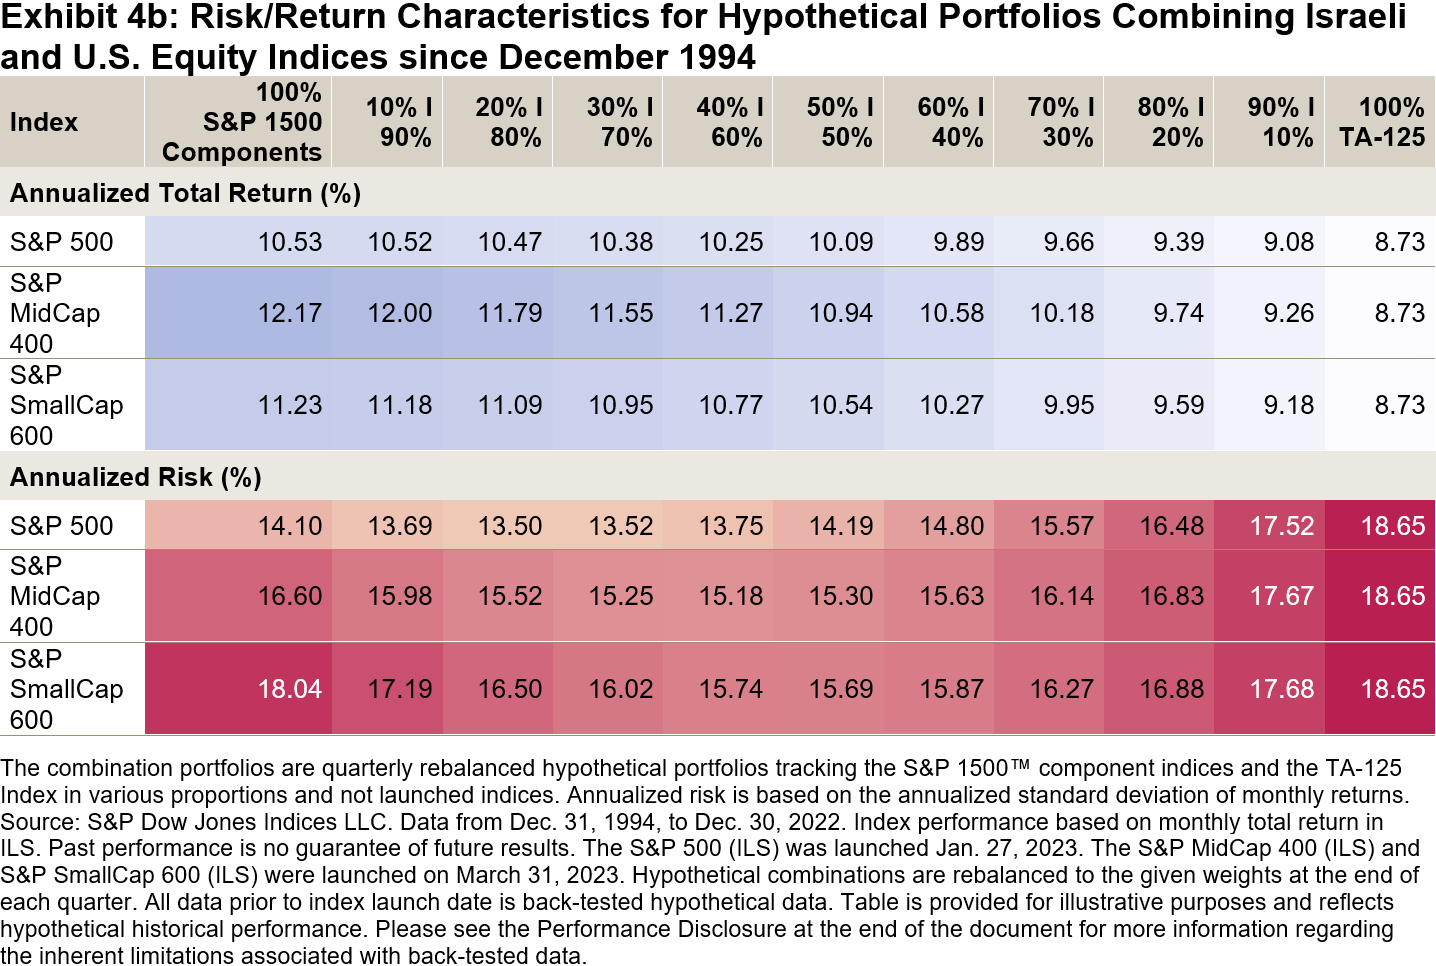
The outperformance of U.S. equities, and their lower long-run correlations with Israeli equities since December 1994, has meant that adding U.S. equities to an Israeli equity allocation could have improved returns, with lower volatility. Exhibit 4a shows the annualized return and volatility figures for various hypothetical combinations of the S&P 500, S&P MidCap 400 and S&P SmallCap 600 with the TA-125, starting with a 100% Israeli allocation and moving in 10% increments to a 100% U.S. equity allocation. Each hypothetical portfolio rebalances back to the target weights at the end of each quarter.

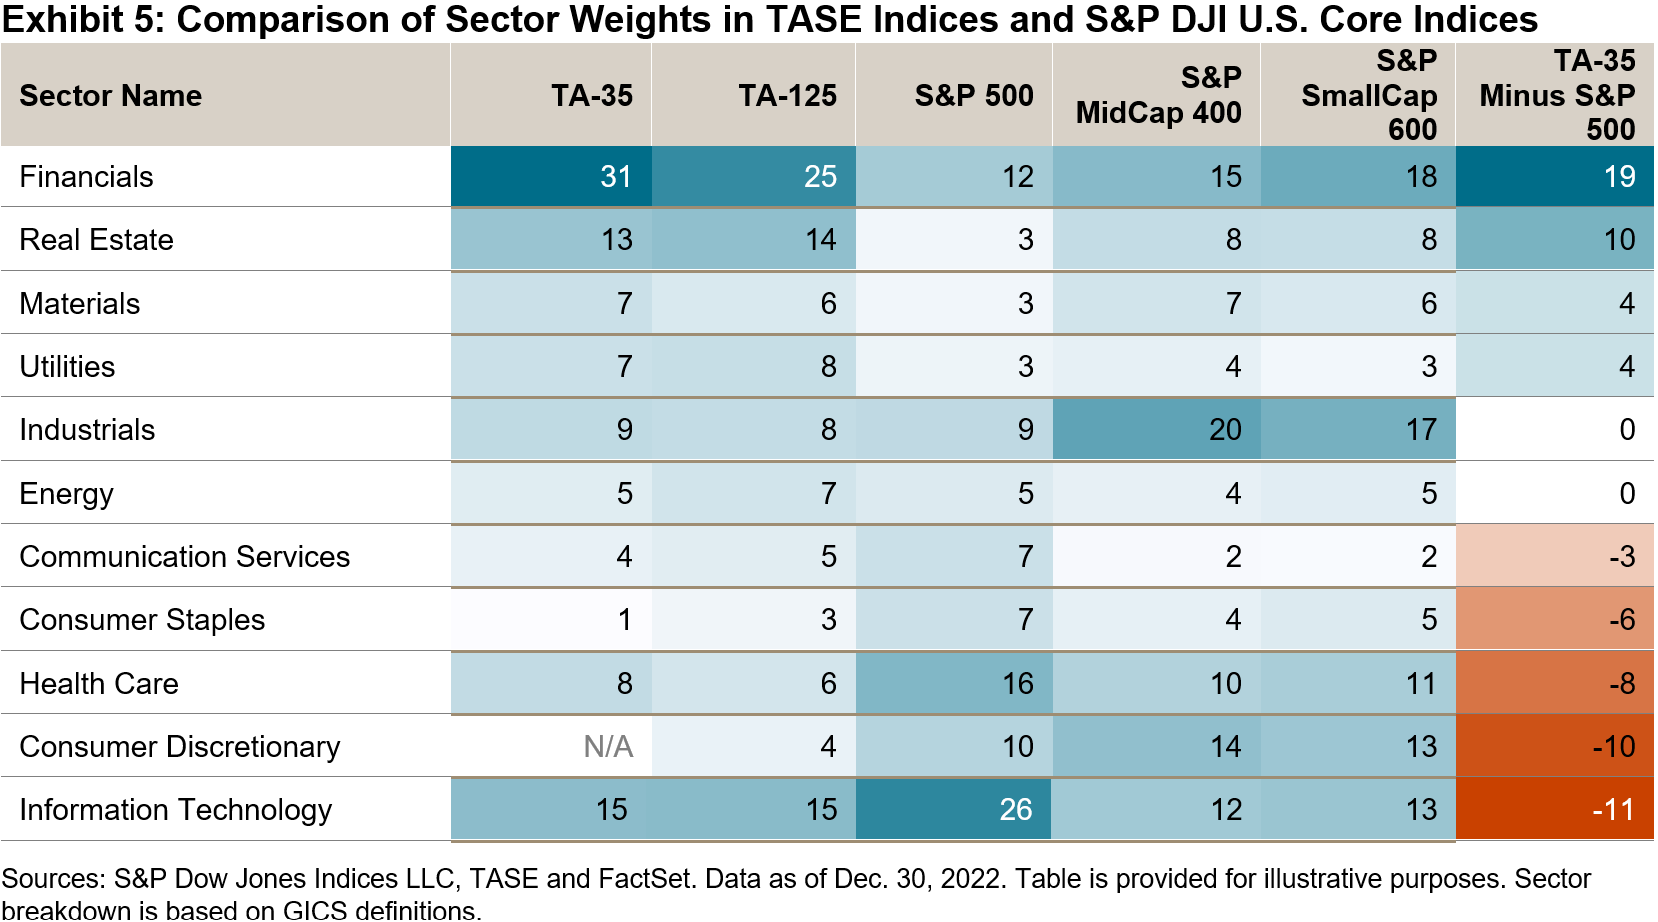
In addition to the potential performance and diversification benefits, incorporating U.S. equities may help Israeli investors to alleviate domestic sector biases. Compared to the S&P 500, Israeli equity indices like the TA-125 and TA-35 are heavily overweight Financials and Real Estate, while underweighting Information Technology by 11%, as shown in Exhibit 4b. The S&P 500’s largest constituents include some of the world’s most well-known “big tech” companies, such as Apple and Microsoft.

While U.S. equities are not the only way to seek diversification, investors may wish to evaluate their U.S. equity exposure in order to avoid overlooking a sizeable portion of the global opportunity set. A simple flourish of U.S. equities may not be enough to decorate a home, and so one may want to consider a real twist to measure the full potential of U.S. equities across capitalization ranges, especially as smaller U.S. equity segments are as large as other countries’ stock markets.

The posts on this blog are opinions, not advice. Please read our Disclaimers.

SPIVA Japan Scorecard 2022: Active Underperformance Despite an Abundance of Opportunities

Contributor Image
Maya Beyhan

Senior Director, ESG Specialist, Index Investment Strategy

S&P Dow Jones Indices

The inaugural S&P Indices versus Active (SPIVA®) U.S. Scorecard was published in 2002, and has since been extended to Australia, Canada, Europe, India, Japan, Latin America, South Africa and the Middle East & North Africa (MENA), allowing investors to experience the active versus passive debate on a global scale.

The SPIVA Japan Scorecard measures the performance of actively managed funds domiciled in Japan against their respective S&P DJI comparison benchmarks over various time horizons, covering large-, mid- and small-cap, as well as international and global equity funds.

According to the recently published SPIVA Japan Year-End 2022 Scorecard, 70% of All Japanese Equity funds underperformed the broad-based S&P Japan 500 over the full-year 2022, and more than half of equity funds underperformed their benchmarks in every reported category, except for International Equity funds, which had an underperformance rate of 42% (see Exhibit 1).

Several aspects of the market environment in 2022 stood out as potentially indicative of a favorable environment for active managers in Japanese equities over the period. For example, the largest companies (as represented by the S&P/TOPIX 150) had lower returns than small- and mid-sized Japanese companies (as represented by the S&P Japan MidSmallCap; see Exhibit 2). This potentially created a tailwind for active managers, as funds are typically less likely to own all the largest stocks at market weight.

Second, opportunities for outperformance through stock selection were plenty in 2022. At the benchmark level, dispersion is the measure of the degree to which securities differ—above or below—the average performance.1 As illustrated in Exhibit 3, the average monthly annualized dispersion in the securities of the scorecard comparison indices was higher in 2022 than was typical over the past 10 years.

Due to the costs associated with running any portfolio, an actively managed fund may still underperform even if it picks outperforming securities. For an active manager, the key is to find not just securities that outperform, but those that outperform materially. At times when most securities perform similarly, differentiation is surely harder to find. Then, there are other times when the difference between winners and losers is larger.

Taken all together, the data in the SPIVA Japan Year-End 2022 Scorecard suggest that among the active funds offered in Japan, International Equity managers were relatively more successful in turning opportunities into positive outcomes. However, active funds in all the other fund categories struggled to take advantage of the abundance of opportunity presented in 2022’s market environment.


1 For example, see Edwards, Tim and Craig J. Lazzara, “Dispersion: Measuring Market Opportunity,” S&P Dow Jones Indices, 2014.

The posts on this blog are opinions, not advice. Please read our Disclaimers.

Examining Passive Performance at the Core

How does indexing work for large-cap equities? S&P DJI’s Hamish Preston and State Street Global Advisor’s Michael Arone take a closer look at lessons from 20 years of SPIVA, including fee savings, outperformance, and what the latest GICS® changes mean for sectors and industries moving forward.

The posts on this blog are opinions, not advice. Please read our Disclaimers.

Diversification and Performance: Potential Applications of U.S. Equities in Japan

Contributor Image
Cristopher Anguiano

Senior Analyst, U.S. Equity Indices

S&P Dow Jones Indices

The U.S. equity market is by far the largest in the world, representing 57.7% of the global market capitalization, and it is nearly nine times the size of the Japanese equity market (see Exhibit 1). Hence, Japanese investors may wish to consider U.S. equities in order to not overlook a significant portion of the global opportunity set.

The S&P 1500™ is designed to measure the performance of the U.S. equity market and its construction helps it avoid less liquid, low priced and lower quality stocks. The index combines the S&P 500®, S&P MidCap 400® and S&P SmallCap 600® and captures over 90% of the U.S. equity market capitalization. Although smaller U.S. equity segments may seem less relevant to international investors, the breadth and depth of the U.S. equity market means that mid- and small-cap U.S. equities represent a significant portion of the global market and are larger than some regional markets.

The U.S. equity market has distinct sector exposures, so one potential benefit of incorporating U.S. equities is that they can help to alleviate domestic sector biases. For example, Exhibit 2 shows the GICS® sector weights of the Japanese equity market—as represented by the S&P Japan 500—and its relative sector weights versus the S&P 1500. Adding U.S. equities can help redistribute sector weights toward the I.T., Health Care and Energy sectors, while also decreasing the concentration to Industrials, Consumer Discretionary and other sectors.

The historical performance of U.S. equities may offer another potential reason for Japanese investors to consider U.S. equities. Exhibit 3 shows that the U.S. equity indices have outperformed the Japanese equity indices since 1994. The S&P 1500 slightly outperformed the S&P 500 due to its exposure to mid and small caps.

Exhibit 4 depicts the long-term risk/return tradeoff for several hypothetical portfolios combining the S&P Japan 500 and S&P 1500 in JPY. The chart shows that increasing allocation to the S&P 1500 provided better performance than purely local strategies, historically.

From its representation of a significant portion of the global opportunity set, to potential sector diversification benefits and historical performance improvements, U.S. equities may be worth consideration for Japanese market participants.

The posts on this blog are opinions, not advice. Please read our Disclaimers.

The “Devil’s Metal” Vanishes, Precious Metals Shine and Energy Dims: Commodities Quarterly Wrap

Contributor Image
Brian Luke

Senior Director, Head of Commodities, Real & Digital Assets

S&P Dow Jones Indices

“Jamie ran on down to the LME, but the devil caught him there,

He took Mr. Dimon’s Nickel bags and vanished in the air,

Set out running but I’ll take my time,

A friend of the devil is a friend of mine”

-adaptation of Grateful Dead’s “Friend of the Devil”

Just one year after the London Metal Exchange (LME) nickel market broke down, the “devil’s metal” found itself back in the headlines. This time around, the LME reported that 54 metric tons, worth about USD 1.3 million, of nickel turned out to be bags of stones.1 J. P. Morgan was revealed to be the registered owner tied to contracts slated for physical delivery, and the S&P GSCI Nickel registered a 20.54% decline for Q1 2023. Nickel represents more than a third of the S&P GSCI Electric Vehicle Metals Index and the component’s performance has dragged the overall index into bear market territory, with a one-year return of -24.73%.

Commodity-based inflation readings (including food and energy) experienced record drops in the eurozone. That didn’t stop silver and gold from rebounding nicely on the month, as the non-commodity inflation indicators, or core measures, continued to give credence to central banks focused on bringing price increases down to a simmer. The S&P GSCI Silver and S&P GSCI Gold rallied total returns of 15.11% and 7.61%, respectively.

Widening out to the broad commodities market, the world’s leading commodities benchmark, the S&P GSCI, lagged stock and bond indices, falling 1.07%. Meanwhile, the S&P GSCI Energy fell 3.49% for the month, and oil futures continued to show discounts out the forward curve, supporting expectations that supply constraints will abate. Output of nearly half a million barrels of oil, or 5% of global production per day, was cut by a court ruling in favor of the Iraqi government. Iraq successfully argued that Turkey violated prior agreements by importing oil from the Kurdistan Regional Government.

The worst-performing segment of the S&P GSCI was natural gas, dropping 23.22% to its lowest level since January 1994. Following a mild winter and expected seasonal demand declines in spring, natural gas storage levels have come down. U.S. capacity to convert to liquified natural gas (LNG) picked up with the resumption of shipments from the Freeport LNG export plant in February. Four more LNG plants were expected to be built to meet European demand. However, increased borrowing costs and lower gas prices were cited as reasons for halting two of those plants.

Within agriculture, the S&P GSCI Sugar rallied 11.32% in March, hitting a five-year high as India cut exports after rain damage to their sugar crop. The S&P GSCI Sugar has been the “sweetest” or best-performing constituent of the 24 commodities comprising the headline S&P GSCI in 2023, up 20.27% YTD and 27.63% year-over-year.

1 Home, Andy. “The return of the London Metal Exchange’s nickel curse.” Reuters. March 21, 2023.

The posts on this blog are opinions, not advice. Please read our Disclaimers.