Get Indexology® Blog updates via email.

In This List

What Canada Is Missing

High Levels of Dispersion across the Commodities Complex in May

Managing and Planning through Uncertain Times from an FA Perspective

The Dow and the World Around It

Update: Tesla’s Standing in the S&P 500 ESG Index

What Canada Is Missing

Contributor Image
Tim Edwards

Managing Director, Index Investment Strategy

S&P Dow Jones Indices

Canadian investors have long participated in U.S. equity markets, but are materially underweight in U.S. mid- and small-cap companies.

In this respect, Canadians resemble their European counterparts, whose investments in the U.S. rarely range beyond those companies included in the S&P 500®. This underinvestment is surprising for several reasons. European market participants are no stranger to U.S. equities, nor the case for global diversification, and small- and mid-cap U.S. stocks compose, in aggregate, a significant segment within the global equity opportunity set. Last but not least, S&P DJI’s U.S. small- and mid-cap indices—the S&P SmallCap 600® and the S&P MidCap 400®—have outperformed the more internationally-famous S&P 500 since their launch in the 1990s; typically no deterrent to fund flows. Canadians show a similar, if somewhat less extreme, hesitancy in venturing beyond blue chips.

Exhibit 1 illustrates the estimated relative weights of various geographic and U.S. size segments in the global equity market and Canadian fund market. The left-hand chart shows weights in the S&P Global BMI, a broad-based gauge of developed and emerging equities. On the right, we combined assets under management in Canadian equity funds to estimate aggregate allocations to the same segments.

Like their counterparts across the Atlantic (and other oceans), Canadian investors demonstrate a “home bias”. Notwithstanding this common and, some argue, quite rational feature of international portfolios, Exhibit 1 illustrates that Canadians are quite comfortable investing in their neighbor’s exchanges, with an aggregate allocation to U.S. large caps of 37%, versus a market weight of 39%.

However, in aggregate, the small- and mid-cap segments only received an aggregate allocation of 5%, less than one-third of the global weight of 17%. Mid caps were most underweighted in absolute terms, with a 7% difference between Canadian and market weights, but smaller companies were the more underweighted in relative terms, with a 1% allocation to U.S. small caps versus a 6% global weight.

One factor that could explain the historical lack of international participation in U.S. mid- and small-cap segments is that investors’ performance may not have been as good as that of S&P DJI’s benchmarks. Smaller stocks are more expensive to trade, and the in-category record of active managers has been relatively poor over the past decades. However, an alternative is now available. With index funds for U.S. mid- and small-cap segments developing track records across global markets, including in Canada, a broader range of market participants may feel comfortable accessing this previously overlooked source of returns.

If you’d like to dig deeper into the topic, I’ll be presenting this research along with some related thoughts at an upcoming S&P DJI webinar for Canadian professional investors. Experts from the fund management and advisor industries will also be there to discuss efficient access to U.S. equity markets beyond the blue-chip names, and whether the forward returns of smaller stocks might be expected to help diversify or damage Canadian investor portfolios. The sign-up link is here

Note: Thanks and credit for Exhibit 1 are due to Sherifa Issifu, co-author on the earlier European work.

The posts on this blog are opinions, not advice. Please read our Disclaimers.

High Levels of Dispersion across the Commodities Complex in May

Contributor Image
Fiona Boal

Managing Director, Global Head of Equities

S&P Dow Jones Indices

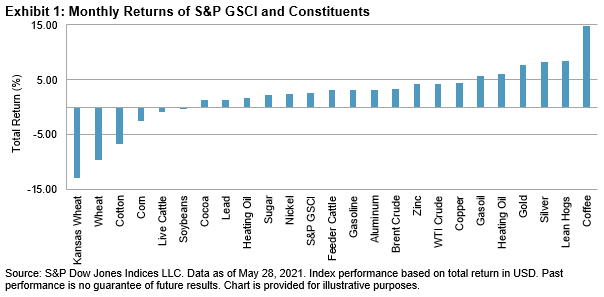
At the headline level, it was a rather subdued month for commodities. The S&P GSCI gained 2.5%, taking YTD performance to 26.0%. While the S&P GSCI’s upward momentum attenuated, high dispersion in the performance of single commodities continued, albeit with reversals among the leaders and laggards. Most of the grains sagged to the bottom of the performance table after surging in April, while feeder cattle, silver, and gold switched ends of the table. Coffee offered an exception, with caffeine-boosting double-digit gains in both periods.

A more positive demand story across the U.S. and parts of Europe supported the petroleum complex in May. The S&P GSCI Petroleum gained 4.2% over the month. According to OPEC+, the oil glut built up during the COVID-19 pandemic has almost been depleted and stockpiles will decline swiftly in the second half of the year. Following various courtroom and boardroom defeats for Western oil companies in the name of cutting carbon emissions in May, OPEC and its allies could be afforded additional influence over global oil supplies in the years ahead.

News that Chinese regulators would show zero tolerance for monopolistic behavior or inventory hoarding in commodities markets did little to cool industrial metals prices in May. The S&P GSCI Industrial Metals rose 3.7%, while the S&P GSCI Copper gained 4.4%. Industrial metals continue to benefit from the world’s largest economies building back greener from the COVID-19 shock, while miners and investors remain reluctant to expand supply, despite the surge in prices. In the end, Beijing’s focus on curbing speculation may do little more than reduce liquidity on the local exchanges and reduce onshore metal stockpiles, which could have the unintended impact of putting upward pressure on prices in an already tight market.

It was a good month for precious metals. The S&P GSCI Precious Metals rallied 7.7%, as market participants switched their focus back to the risk of inflation and the U.S. dollar fell. The S&P GSCI Gold hit a near five-month high at the end of May, benefiting from a rebound in demand for jewelry, bars, and coins in China.

The S&P GSCI Agriculture finished the month down 3.2%. The complex was hit by a reversal in fortune across the grain markets, with corn and wheat ending the month notably lower. Rumors of China cancelling U.S. corn cargoes or limiting exports rocked the market, which until recently had enjoyed an impressive multi-month rally following an abrupt tightening of global corn supplies. It was a similar story in wheat; the S&P GSCI Kansas Wheat fell 12.8% over the month.

The S&P GSCI Livestock gained 3.2% in May. A fall in feed costs helped lean hog and feeder cattle prices, while lean hogs also benefitted from strong wholesale pork demand and tight supplies of market-ready hogs.

The posts on this blog are opinions, not advice. Please read our Disclaimers.

Managing and Planning through Uncertain Times from an FA Perspective

Contributor Image
Stuart Magrath

Former Senior Director, Channel Management, Australia and New Zealand

S&P Dow Jones Indices

In March 2021, we facilitated a discussion during S&P DJI’s virtual event with two financial advisors from Australia and Canada and an NZX representative who works closely with FAs in New Zealand. We asked them to reflect on the past year and how they pivoted with the onset of the Covid-19 pandemic.

Andrew Neatt, TD Wealth Private Investment Advice, shared how in the early days of the pandemic in Canada, he increased the quality exposure of his clients. This addition gave clients reassurance that companies of higher quality were more likely to perform relatively better when plunged into the unknown presented by the pandemic. In Andrew’s blog, he examined how the S&P 500® Quality Index and S&P 500 Low Volatility Index performed during bear markets. In fall 2020, Andrew started to take a longer-term view on the growth expected in the economy and added some small-cap exposure, using the S&P SmallCap 600®.

Jermaine Cooper, NZX, described how New Zealand had a delayed response to the virus, due to its late arrival. Kiwi FAs de-risked their clients’ portfolios, then reverted to a more aggressive portfolio when markets roared back to life. Some investors elected to stay in a “risk-off” mode given the ongoing pandemic, despite the low number of fatalities in the country.

In Australia, Andrew Wielandt, DP Wealth Partners, said he reviewed and adjusted his client portfolios, including embracing ETFs to drive diversification. What he found was clients who had agreed to de-risk their portfolios suffered a loss of about 12%, whereas those who kept risk-on suffered decreases of up to 35% when the market bottomed out in March 2020.

Andrew W. also spoke of joining S&P DJI’s study tour to the U.S. and Canada in 2018. During the study tour, he learned that the SPIVA® Australia Scorecard results that showed most active managers underperformed most of the time were not an isolated example; the results were replicated globally.

Andrew compared the study tour to boot camp: “When I came out of it, I was broken. I came back and said to my clients and the team in Toowoomba—we’ve got to change!”

Andrew also referenced professional indemnity insurance and that insurers are taking a more favorable view of businesses that use model portfolios through ETFs.

With optimism that the worst of the pandemic was over in March 2021, our three experts spoke about what’s next. In Canada, Andrew N. described his firm as long-term strategic thinkers who seek to make as few changes as possible to client portfolios. As such, small changes on the margins is their approach, with minimal disruption to their strategy. His view is that a good, long-term strategy will almost always add value over time.

The subject of ESG was also raised with our three guests. Jermaine shared there is a huge demand in New Zealand, and ESG is a constant topic of conversation, with FAs and investors seeking opportunities that address ESG concerns broadly and in-depth.

Andrew N. described the introduction of several stand-alone ESG model portfolios in early 2021. In Canada, ESG conversations are more numerous this year than last.

Similarly, in Australia, younger clients are proactively seeking out ESG options. Andrew W. now includes asking clients about ESG as part of the fact-finding process.

At S&P DJI, we recognize that ESG integration has become increasingly important and now offer a series of ESG indices—including the flagship S&P/ASX 200 ESG Index and the recently launched S&P/NZX Carbon Efficient Indices.

Finally, we asked our guests to share a significant or interesting risk they are discussing with clients. For Jermaine, a key risk is cybersecurity, given the NZX’s experience in 2020. The exchange was attacked for seven days, leading to a trading halt and loss of significant revenue, as well as the cost of hiring experts to fend off the attacks. FAs need to be aware that they too may be subject to these kinds of attacks.

For Aussie Andrew, the risk he is discussing is the same as pre-pandemic. Are client portfolios too concentrated? Clients may have just been given their one “get out of jail free card,” with their portfolios having essentially reset. Now might be a good time to reevaluate their portfolios, otherwise wildly swinging portfolios may continue.

Finally, Canadian Andrew described the largest risk for clients as the fixed income environment over the next 3-5 years. How can an acceptable return be generated from the defensive portions of a portfolio?

Despite the economic, political, or even medical events that may buffet portfolios, there’s almost always a message that FAs can bring to their clients, with indexing front and center.

The posts on this blog are opinions, not advice. Please read our Disclaimers.

The Dow and the World Around It

Only one index has endured through half of American history. Explore the historic path of the original index icon.


To learn more about the history of the DJIA and to celebrate its 125th anniversary, please visit: https://www.spglobal.com/spdji/en/landing/topic/djia-125/

The posts on this blog are opinions, not advice. Please read our Disclaimers.

Update: Tesla’s Standing in the S&P 500 ESG Index

Contributor Image
Daniel Perrone

Former Director and Head of Operations, ESG Indices

S&P Dow Jones Indices

As discussed in my previous blog, Tesla would not be an immediate addition to the S&P 500® ESG Index following its addition to the S&P 500 on Dec. 21, 2020. Instead, the ever-popular automaker would have to wait until the next annual rebalance of the index. This rebalance finally took place, and as of May 1 , 2021, Tesla officially became a constituent of the S&P 500 ESG Index. Tesla’s inclusion begs two questions: how did we get here, and what does it mean?

Tesla’s entry into the S&P 500 ESG Index could be due to the index methodology as much as Tesla’s own improvement from a sustainability perspective. Tesla’s S&P DJI ESG Score was 22 out of 100 (up 8 points from last year’s score), driven by its ESG Dimension Scores, including an Environmental score of 28 (up 1 point), a Social score of 6 (up 2 points), and a Governance score of 49 (up 21 points). Though there are numerous factors at play with regards to Tesla’s final score, such as the ESG performance of its industry competitors globally, with this rebalance, Tesla’s standing among its industry group peers in the S&P 500 improved from the last rebalance (if it had been in the S&P 500 last year).

The automaker is not reviewed in a vacuum, however. Where it stands relative to its peers matters. The selection process for the S&P 500 ESG Index is performed on a GICS® industry group basis. As of the rebalancing reference date, Tesla was ranked fifth out of five companies in the Automobiles & Components industry group of the S&P 500.

Why would the worst-ranked company in a particular industry group be selected as a constituent? The S&P DJI ESG Score is only one component of the selection process. There is also a market capitalization element applied, which is designed to keep the GICS industry group weights of the S&P 500 ESG Index similar to the S&P 500.1

As shown in Exhibit 1, selecting the top four companies in the industry group results in only 25% of the industry group FMC being selected. By selecting Tesla, 100% of the industry group’s FMC is selected, which is closer to the target 75% FMC than if the company were not selected (a critical component of the selection methodology). This means that Tesla’s size, more than its sustainability performance, was the main driver in its inclusion.

So, what is a relatively low-scoring company doing in an ESG index anyway? The answer lies in the objective of the S&P 500 ESG Index to be a broad-based index that measures the performance of the securities from the S&P 500 that meet sustainability criteria , while maintaining similar overall industry group weights as the S&P 500. This is achieved by targeting 75% of the FMC of each industry group. The addition of Tesla, however, does not drastically shift the active industry group weights between the S&P 500 ESG Index and the S&P 500 (see Exhibit 2).

Furthermore, in a broad-market ESG index such as the S&P 500 ESG Index, lower-scoring companies do tend to be included, mainly to provide that broad exposure.

What does this mean for the future of Tesla in the S&P 500 ESG Index? Its current size does not ensure it will stay a constituent in the index in perpetuity—the company must still pass the minimum ESG score threshold eligibility criterion2 at each annual rebalance, and of course must not become involved in controversial weapons, tobacco, or thermal coal. The company must also remain in good standing with the UN Global Compact.

Tesla’s size could have significant implications on the ongoing status of its industry peers if the company’s ESG score continues to increase. It’s impossible to say how Tesla’s ESG score will change in the future, though their commitment to no longer accept Bitcoin as payment for environmentally focused reasons has been a big story in ESG circles. For now, questions about Tesla’s standing in the S&P 500 ESG Index have been answered.

1 For more details on the selection methodology, please reference the S&P 500 ESG Index Methodology.

2 Companies with an S&P DJI ESG Score that falls within the worst 25% of ESG scores from each global GICS industry group are excluded from the index, as per the


The posts on this blog are opinions, not advice. Please read our Disclaimers.