


The demand from investors for environment, social, and governance (ESG) data and ESG products has never been stronger. This has triggered a growing industry of ESG data providers in the market. It is vital for S&P Dow Jones Indices (S&P DJI), when choosing ESG data providers who drive our ESG solutions to work with market-leading global practitioners. These practitioners must be able to demonstrate in-depth company analysis and robust governance structures, ensuring the quality of their data and our products.
Some investors have used ESG data in investment processes for many decades. S&P DJI launched the first-ever global sustainability benchmark, the Dow Jones Sustainability World Index[i] over 20 years ago, partnering with ESG rating specialist SAM. In recent years, the uptake in using ESG data in the investment community has been notable. For instance, the number of financial institutions signing up to the Principles for Responsible Investment has been increasing year over year, with over 2,250 signatories in 2019.[ii]
There are many drivers for this increased interest in ESG investing. One is expanding regulations, particularly in Europe. Another is more ESG data being made available to investors as a result of improving company disclosures. There is also increasing awareness and acceptance from investors regarding the financial materiality of ESG data and the role it can play in aiding investment decisions.
This momentum behind ESG investing has intersected with a trend toward passive investment, as investors continue to look for transparent, low-cost, and tax-efficient alternatives to actively managed, higher-cost products. This dual increase of money moving into passive and ESG solutions makes it essential for S&P DJI to continue to invest in quality, innovative, and deep ESG sources.
S&P DJI’s long-term partner, SAM, continues to provide us with some of the most robust ESG ratings available in the market, with a depth of company engagement that is unrivaled among its peers. The data that SAM provides us also powers our own S&P DJI ESG scores, which are used in many of our ESG indices, including our S&P ESG Index Series launched in 2019.[iii]. SAM was acquired by S&P Global in January 2020. In our recent webinar—Using ESG Data to Simplify the Complex—Manjit Jus of SAM explored how ESG data sets can be used in ESG indices.
Climate is often the top issue for investors when considering ESG issues. This has long been recognized by S&P DJI, as we launched the S&P Global Carbon Efficient Index Series back in 2009. In developing our carbon-efficient indices, we sought to partner with a high-quality global carbon data provider, ultimately selecting Trucost (part of S&P Global since 2016). Trucost provides us with a wide range of climate metrics that enable us to create the breadth of climate indices demanded by investors. It has proven to be at the forefront of climate innovation by regularly launching new climate data sets as investor needs evolve. For instance, in developing an index concept that aligns with requirements of the EU climate benchmark regulations, we rely upon several innovative Trucost datasets, including global scope 3 data, physical risk datasets, and transition pathway data.[iv]
Our offerings provide access to the highest-quality ESG data and ESG indices, utilizing the in-house research of SAM and Trucost, both of which are part of S&P Global. This, coupled with our lengthy history of providing independent and transparent indices, positions us well to supply the broad suite of high-quality ESG index solutions increasingly required by the market.
You can learn more about the vital role of data in ESG indices in the replay of our recent webinar, Using ESG Data to Simplify the Complex.
[i] Dow Jones Sustainable Index https://spdji.com/indices/equity/dow-jones-sustainability-world-index
[ii] PRI 2020, About the PRI https://www.unpri.org/pri/about-the-pri
[iii] S&P 500 ESG Index https://spdji.com/indices/equity/sp-500-esg-index-usd
[iv] Conceptualizing a Paris-Aligned Climate Index for the Eurozone https://www.spglobal.com/en/research-insights/articles/conceptualizing-a-paris-aligned-climate-index-for-the-eurozone
The posts on this blog are opinions, not advice. Please read our Disclaimers.


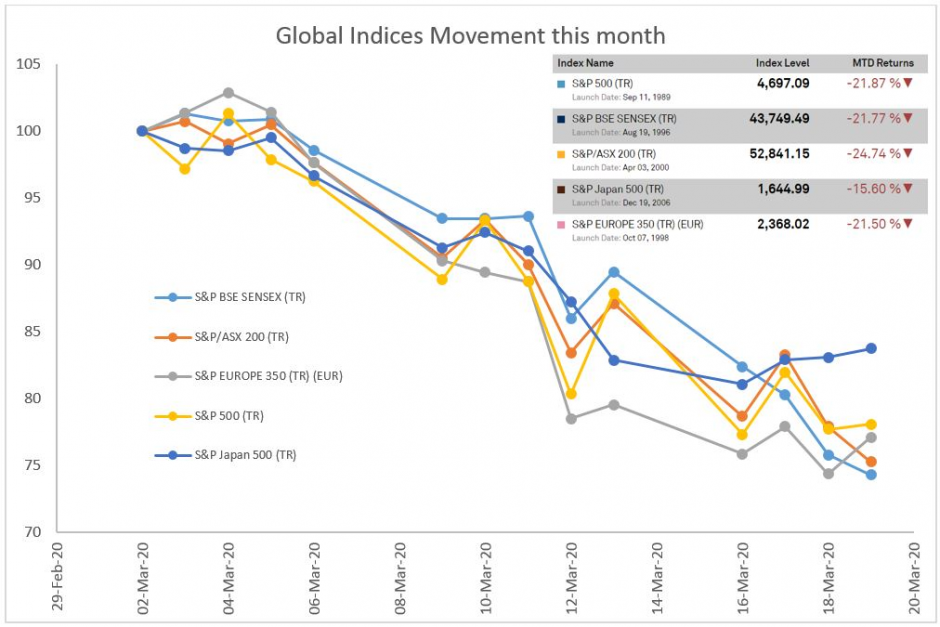 Source: S&P Dow Jones Indices LLC. Data from February 29, 2020, to March 20, 2020. Past performance is no guarantee of future results. Chart and table are provided for illustrative purposes.
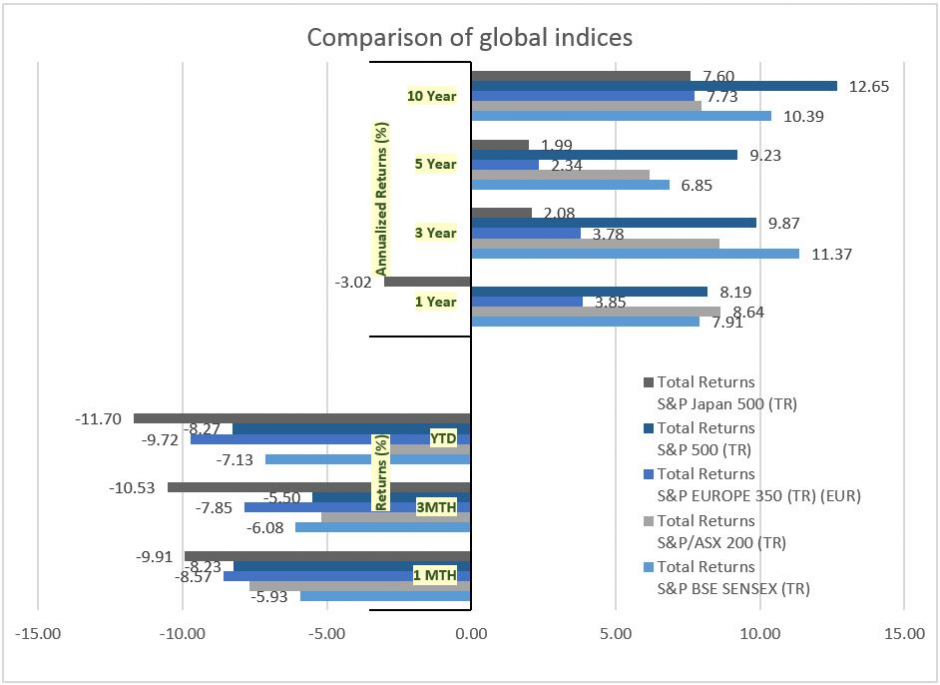 Source: S&P Dow Jones Indices LLC. Past performance is no guarantee of future results. Chart and table are provided for illustrative purposes.
 Source: S&P Dow Jones Indices LLC. Past performance is no guarantee of future results. Chart and table are provided for illustrative purposes.
 Source: S&P Dow Jones Indices LLC. Past performance is no guarantee of future results. Chart and table are provided for illustrative purposes.