Get Indexology® Blog updates via email.

In This List

S&P U.S. Indices Year-End 2022: Analyzing Relative Returns to CRSP

Expanding the Dividend Aristocrats Ecosystem with ESG Screening and FMC Weighting

First Islamic Indices Based on S&P/ASX Series Launched

SPIVA U.S. Scorecard 2022: Fewer Excuses

International Women’s Day Embraces Equity

S&P U.S. Indices Year-End 2022: Analyzing Relative Returns to CRSP

Contributor Image
Cristopher Anguiano

Senior Analyst, U.S. Equity Indices

S&P Dow Jones Indices

The S&P U.S. Equity Indices aim to represent and measure the performance of distinct market cap segments of the investable U.S. equity market. The S&P Composite 1500®, which consists of the S&P 500®, S&P MidCap 400® and S&P SmallCap 600®, is constructed differently compared to other indices with similar objectives. These nuances can impact index characteristics and help to explain differences in performance.

Exhibit 1 shows the performance of these indices against their CRSP counterparts. S&P U.S. Equity Indices typically outperformed over distinct time horizons, and they outperformed across the cap spectrum in 2022, continuing the positive mid-year trend.

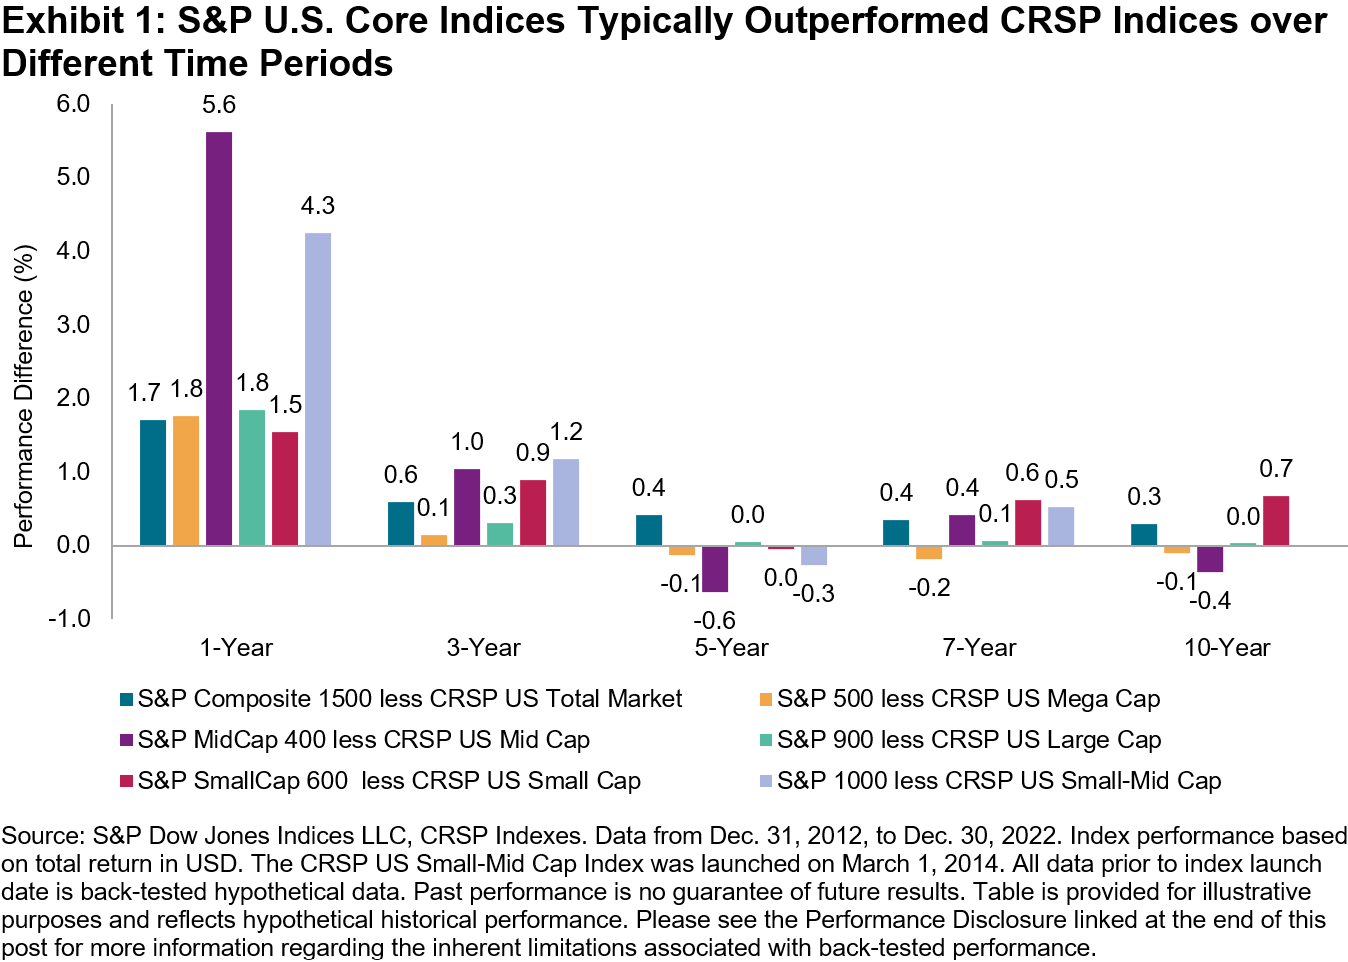
In 2022, the mid- and mid/small-cap segment showed the strongest outperformance numbers: the S&P MidCap 400 and S&P 1000 indices outperformed their CRSP counterparts by 5.62% and 4.26%, respectively, the second-largest calendar year outperformance figures since 2016. Differences in sector exposures were useful in explaining relative returns last year.

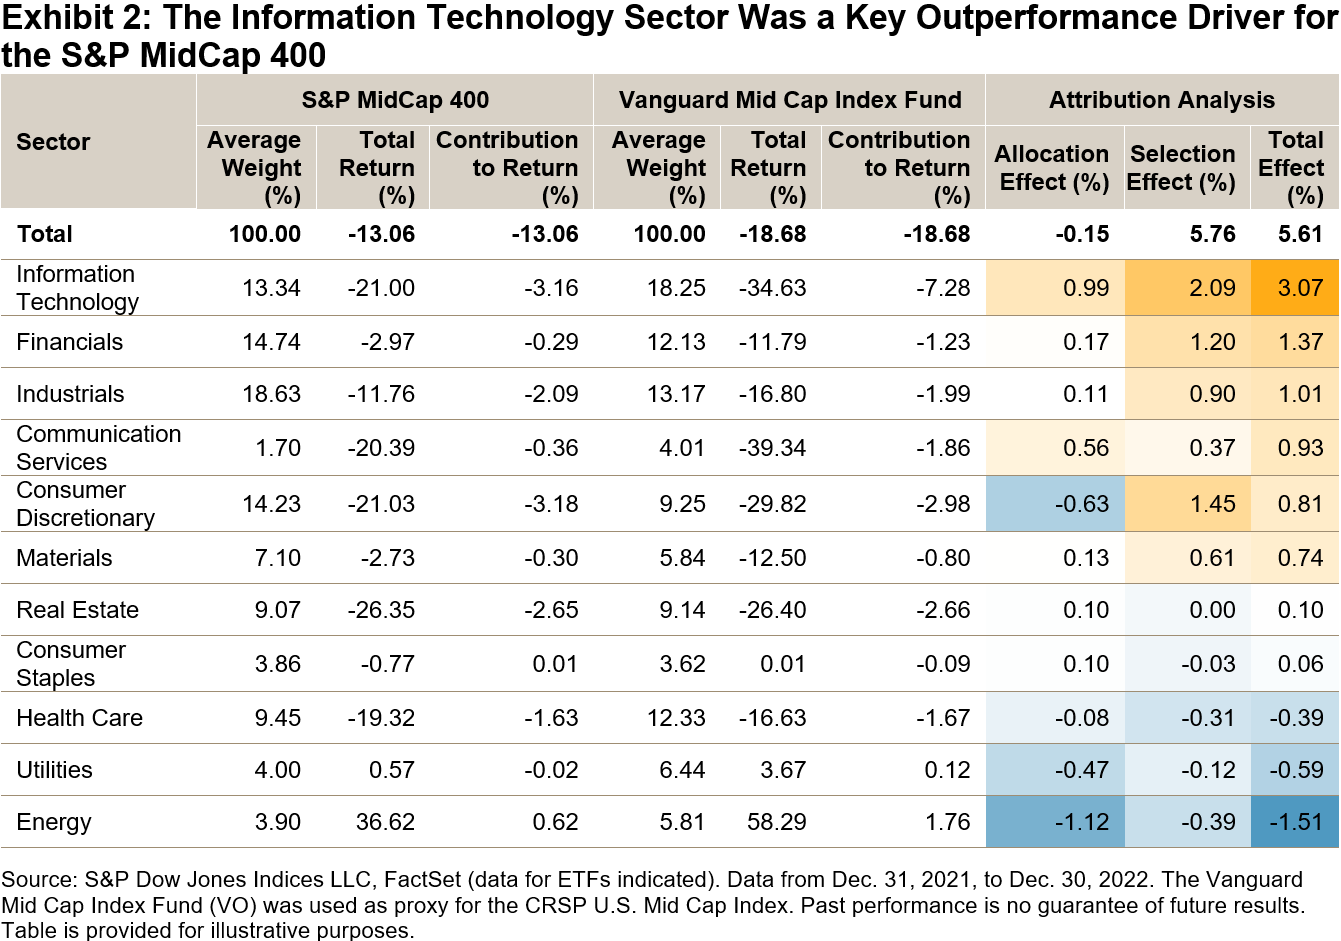
For example, Exhibit 2 shows the attribution analysis of the S&P MidCap 400 against the CRSP U.S. Mid Cap Index. The analysis assesses the portion of S&P 400® relative returns in 2022 that came from differences in GICS® sector exposures (allocation effect) versus the choice of companies in each sector (selection effect). A key takeaway from Exhibit 2 is that while the S&P 400 benefited from having less exposure to IT, which underperformed, the choice of companies in the sector (selection effect) had an even greater impact. Similar results were observed across the cap spectrum in 2022.

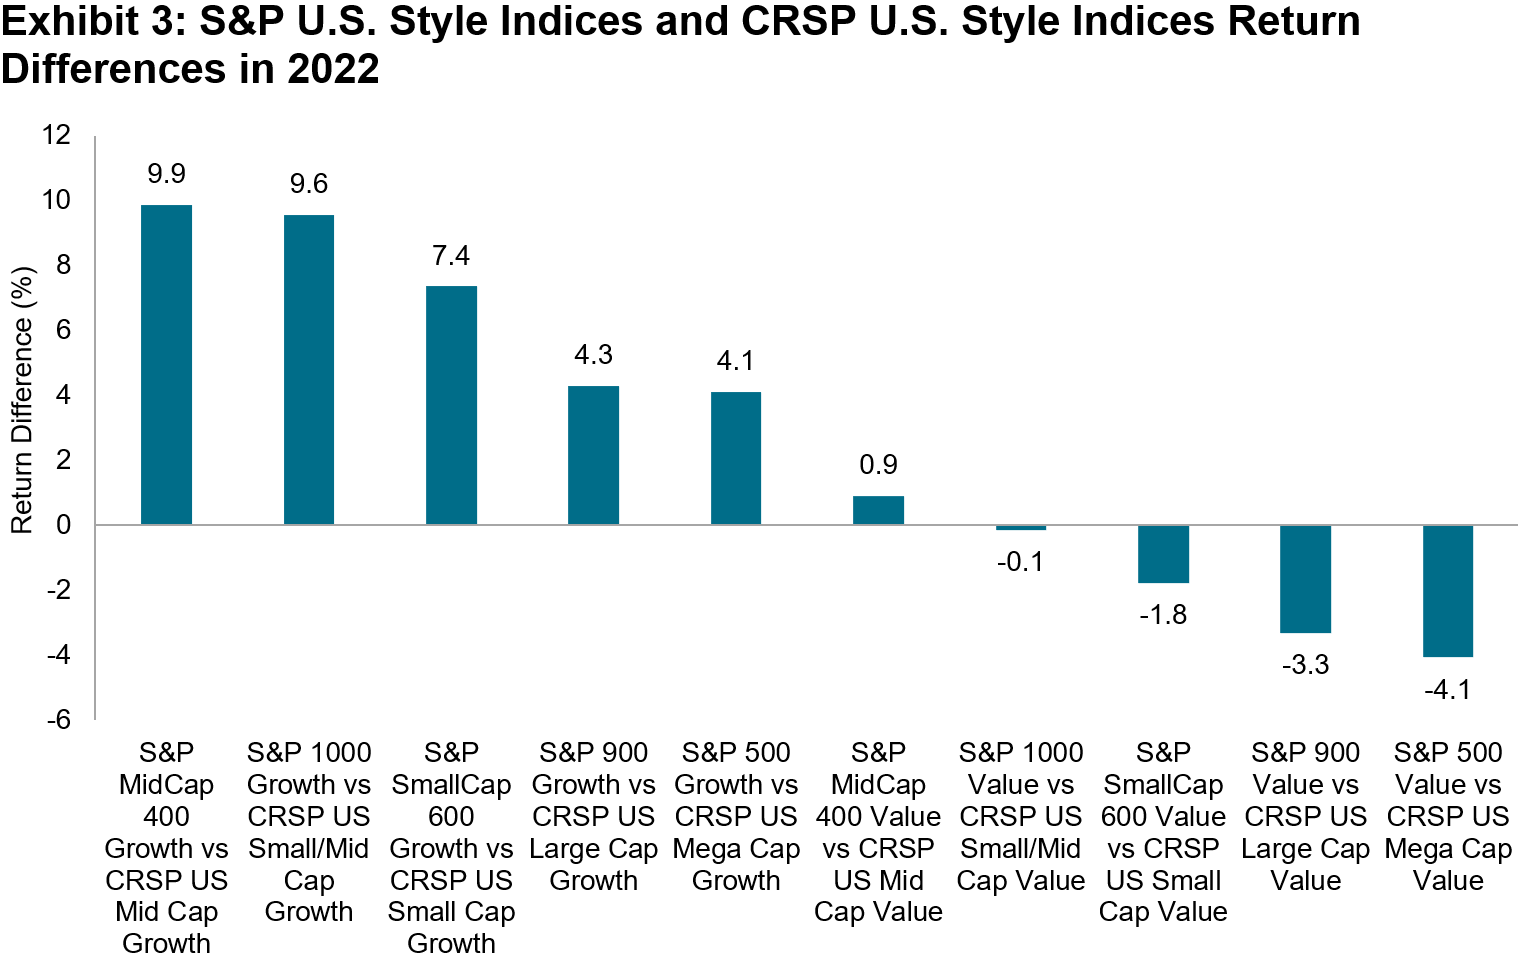
The S&P U.S. Core Indices’ 2022 outperformance drove the S&P U.S. Growth Indices’ relative returns versus CRSP growth indices. Exhibit 3 shows that the S&P U.S. Growth Indices outperformed their CRSP growth counterparts across the market cap spectrum, with the S&P MidCap 400 Growth (9.9%) and S&P 1000 Growth (9.6%) indices recording their second-largest outperformance rates since 2016. S&P U.S. Value Indices generally underperformed, although the S&P MidCap 400 Value slightly outperformed the CRSP U.S. Mid Cap Value Index, by 0.9%.

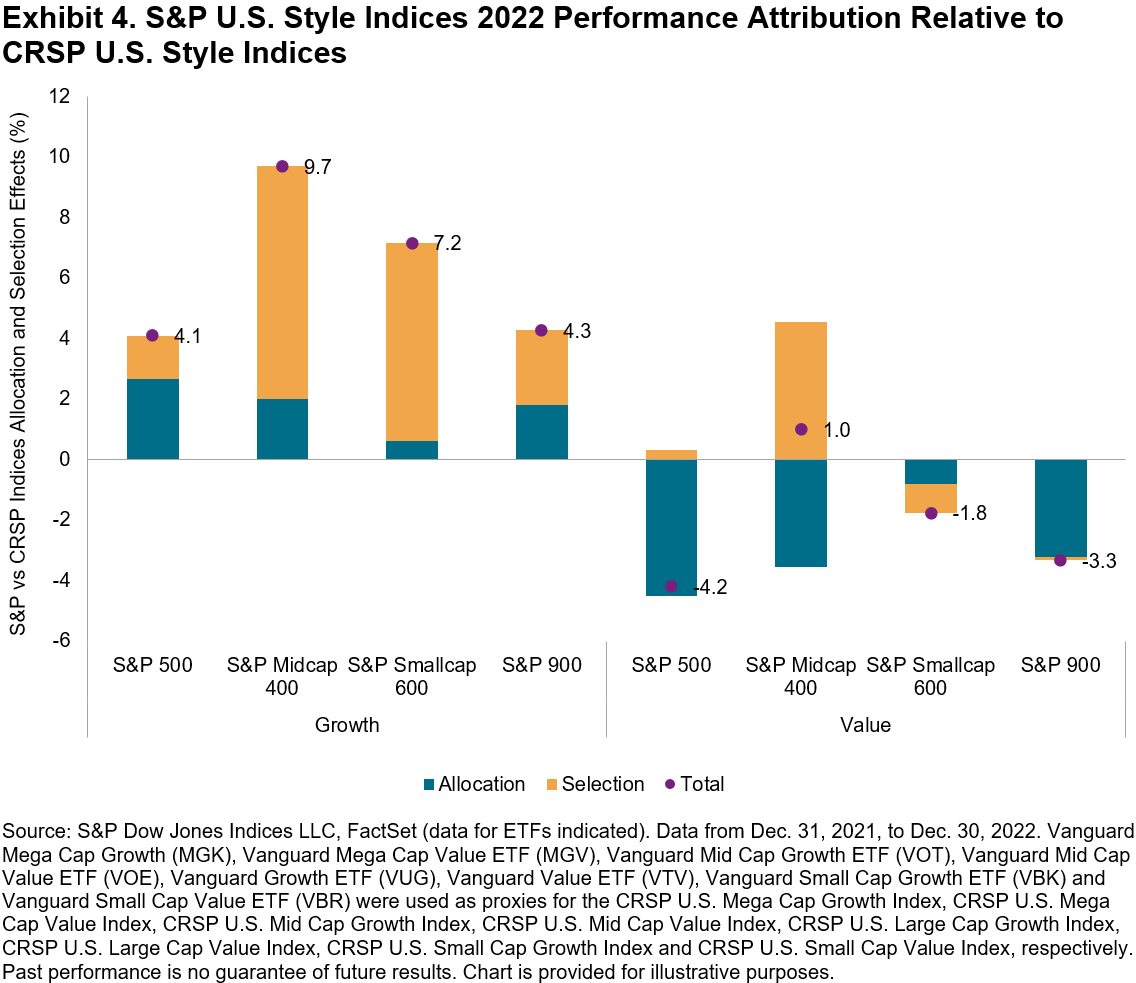
Performance attribution analysis shows that the allocation and selection effects in 2022 were positive for the S&P U.S. Growth Indices (see Exhibit 4). The S&P Growth Indices benefited from less exposures to sectors like IT and more to Energy, as well as the choice of constituents in Financials and IT. The opposite was true for S&P Value Indices, which were particularly hindered by having less exposure to some of the best-performing sectors like Energy. Although sector exposures were a drag, the choice of companies in some sectors like Financials and Consumer Discretionary helped to mitigate some of the negative performance.

Despite a challenging 2022 for the U.S. equity market, S&P U.S. Core Indices outperformed CRSP core indices. Differences in index construction that determine sector exposures and selection of companies were helpful in explaining relative returns. Similarly, S&P Style Indices’ relative returns versus their CRSP counterparts also highlighted that index construction matters. Indices with similar objectives can behave differently, especially over shorter time periods.

The posts on this blog are opinions, not advice. Please read our Disclaimers.

Expanding the Dividend Aristocrats Ecosystem with ESG Screening and FMC Weighting

Contributor Image
George Valantasis

Associate Director, Factors and Dividends

S&P Dow Jones Indices

Amid rising interest rates and the uncertain macroeconomic environment last year, dividend-focused strategies received substantial inflows throughout 2022.  On top of these recent macroeconomic trends is also the longer-term, structural development of increasing investor demand for investments that align with their personal and societal values. Against this backdrop, S&P Dow Jones Indices (S&P DJI) recently launched the S&P ESG High Yield Dividend Aristocrats® FMC Weighted Index, S&P/TSX Canadian ESG Dividend Aristocrats FMC Weighted Index and S&P International Developed Ex-North America & Korea ESG Dividend Aristocrats FMC Weighted Index.

Dividend Aristocrats Methodology + ESG and FMC Weighting

The three indices start by incorporating the Dividend Aristocrats methodology of selecting companies that have increased or kept stable their dividends over the long term. This methodology can provide a ballast for investors in times of uncertainty, since the ability to consistently grow dividends over a long period of time can be an indication of financial strength, discipline and durable earning power.

Next, the indices exclude companies in the lowest quartile of S&P DJI ESG Scores. Additional ESG exclusion reviews are conducted quarterly based on business activities, as well as United Nations Global Compact (UNGC) breaches. These ESG screens serve to enhance the already stringent qualifications of the Dividend Aristocrats methodology. Lastly, the remaining constituents are float market capitalization (FMC) weighted. The FMC weighting approach enhances the overall liquidity of the index as well as reduces turnover and transaction costs for investors.

Over the long term, Exhibit 1 shows that the three FMC weighted ESG Dividend Aristocrat indices generated materially higher risk-adjusted returns versus their respective benchmarks. The full period risk-adjusted returns for the U.S., Canadian and International Developed versions were improved by 9.1% (0.98 vs. 0.90), 16.8% (0.67 vs. 0.58), and 27.8% (0.44 vs. 0.34), respectively. In addition, all three indices exhibited both lower volatility as well as lower max drawdowns over the full period.

Looking at Exhibit 2, the three ESG Dividend Aristocrats FMC weighted indices hold significant yield advantages over their benchmarks. Over the full period examined, the average dividend yields for the US, Canadian and International Developed FMC-weighted ESG Dividend Aristocrat versions were 2.60%, 3.58% and 3.10%, respectively, compared with 1.76%, 2.98% and 2.91% for their respective benchmarks.

Exhibit 3 shows the notable S&P DJI ESG Score improvement for the three FMC-weighted ESG Dividend Aristocrats indices versus their respective benchmarks. As expected, all three versions demonstrated material ESG improvement over the full time period examined. For the US version, the ESG score was improved by over 17% (73.4 versus 62.4), the Canadian version improved by almost 18% (79.3 versus 67.3), and the international developed version showed an over 11% improvement (85.8 versus 76.7).

The three recently launched FMC weighted Dividend Aristocrats ESG indices may be worth considering for investors seeking long-term historical risk-adjusted outperformance, enhanced dividend yields, and companies that have shared values. For those seeking exposure to these qualities, the FMC-weighting approach provides an additional potential benefit of increasing liquidity and lower transaction costs.


The posts on this blog are opinions, not advice. Please read our Disclaimers.

First Islamic Indices Based on S&P/ASX Series Launched

Contributor Image
Eduardo Olazabal

Associate Director, Global Exchange Indices

S&P Dow Jones Indices

S&P DJI is launching its first S&P/ASX Shariah Indices, which aim to track the performance of Shariah-compliant stocks in the S&P/ASX 200 and the S&P/ASX 300. This launch comes in the context of increased interest in the Muslim community for Shariah investing in Australia.

The Muslim community in Australia accounts for 3.2% of the population, or over 800,000 people as of 2021,1 and has grown at around 5.5% per year over the past 20 years. This expanding segment of the population may need specialized financial services catering to their preferences.

Shariah-compliant investing has grown considerably in recent years, as interest expands outside traditional Islamic markets. By the end of 2022, there were 27 Islamic equity exchange traded funds (ETFs) worldwide, accounting for over USD 1.6 billion in AUM. This was up from USD 347 million AUM in 2017, making Islamic ETFs one of the fastest-growing ETF categories, with a 37% annual growth rate.2

S&P DJI has been the leading Islamic index provider since the launch of the world’s first Islamic benchmarks in 1999. Now with the launch of the S&P/ASX 200 Shariah and S&P/ASX 300 Shariah, the widely used S&P/ASX Indices join some of the world’s most recognized equity benchmarks already with a Shariah-compliant version, such as the S&P 500® Shariah, the S&P/TOPIX 150 Shariah and the S&P/TSX 60 Shariah, to name a few.3

Islamic Indices

Compliant indices cater to the Islamic market by limiting inclusion to companies that pass rules-based Shariah screening. The criteria are defined by a board of Islamic scholars and consist of two main components: business activities and financial ratios (see Exhibit 1).4

Key Characteristics of the S&P/ASX 200 Shariah and S&P/ASX 300 Shariah

These new indices are derived from the S&P/ASX 200 and S&P/ASX 300, Australia’s preeminent equity benchmarks, and are screened for Shariah compliance according to the criteria mentioned above. The resulting Shariah-compliant indices have distinct sector and stock compositions that drive the indices’ risk and return characteristics as shown in Exhibits 2 and 3.

The absence of the Financials sector due to the business activity screen is the most notable difference between the benchmark index and its Shariah-compliant version. This results in a substantial increase in Materials and Health Care weight in the Shariah indices.

While there may be short term risk and return deviations between Shariah-compliant indices and their conventional counterparts, over the long term, these have shown similar risk and return characteristics, as shown in Exhibit 3.

The S&P/ASX Shariah Indices can be used as performance benchmarks for Shariah-compliant investment strategies, the selection universe for actively managed funds and the basis for index-linked products such as ETFs, index mutual funds and structured products. It is also important to note that customization is available to accommodate various preferences or requirements around sector or stock concentration.

1   Source: Australian Bureau of Statistics. Religious affiliation in Australia in 2021.

2   Source: Data from Morningstar as of Dec. 31, 2022. For more information on recent market developments in the Islamic indices space, please refer to the following: The Growth of Islamic Index-Based Strategies.

3   For more information on the performance of the full suite of S&P DJI’s Islamic indices, please refer to the quarterly S&P Shariah Index Scorecard. S&P/ASX Shariah Indices can be found in the Q1 2023 update.

4   For more details on the construction and maintenance of S&P Shariah Indices, please refer to the S&P Shariah Indices Methodology.

The posts on this blog are opinions, not advice. Please read our Disclaimers.

SPIVA U.S. Scorecard 2022: Fewer Excuses

Contributor Image
Tim Edwards

Managing Director, Index Investment Strategy

S&P Dow Jones Indices

For over a decade, our SPIVA® Scorecards have shown a majority of actively managed U.S. large-cap equity funds underperforming the S&P 500®. According to the freshly published SPIVA U.S. Year-End 2022 Scorecard, the annual underperformance rate dropped to the slimmest of margins last year: just 51% of large-cap U.S. managers lagged the S&P 500 in 2022.

Two key market trends associated with active performance provide context for this figure. One, explored by Anu Ganti in an earlier blog, was a sharp relative increase in the opportunity for outperformance across a range of global equity markets. Another, specific to large-cap U.S. equities, was a reversal in the trend of strong performance of the largest stocks.

The latter point matters because one of the virtues often claimed for active management is its avoidance of perceived overconcentration in the largest stocks in the benchmark. Accordingly, active equity funds frequently underweight the index’s largest stocks (or at least some of them); if the largest companies outperform, then active funds are more likely to lag and, compounding the issue, the weight of the largest names will have also increased—so that the active funds will, all else equal, be even more underweight. Thus, as and if the largest stocks continue to outperform, active funds might underperform in ever-increasing degrees.

This is exactly what seems to have happened between 2013 and 2021. In the summer of 2013, the largest five companies in the S&P 500 accounted for roughly 11% of the index’s weight. As Exhibit 1 shows, this concentration more than doubled to over 23% by December 2021; not coincidentally, our SPIVA U.S. Year-End 2021 Scorecard reported a one-year underperformance rate of 85% for actively managed large-cap U.S. equity funds—close to a record high for any year of the scorecard’s 20-year history.

However, as can also be seen in Exhibit 1, concentration began to diminish in 2022. Previous market darlings, including Facebook, Amazon, Alphabet, Microsoft, Tesla and Apple, to name a few, underperformed materially. Meanwhile, as the U.S. dollar strengthened, smaller and more domestically oriented names were judged to have better prospects, while previously unfancied companies in the Materials and Energy sectors benefited from a steep rise in commodity prices. Exhibit 2 summarizes the changes in fortune that swept through markets last year, comparing the annualized excess returns (versus the S&P 500) for a range of large-cap indices in two periods: December 2013 to December 2021, and over the full-year 2022.

Will such tailwinds for active managers continue into 2023 and beyond? It is certainly possible. But it is also worth emphasizing that, even now, there is still plenty of ground for active managers to make up if they hope to change the long-term statistics; according to the year-end 2022 scorecard, 91% and 95% of all actively managed large-cap U.S. equity funds underperformed the S&P 500 over 10 years and 20 years, respectively.

If an underperformance rate close to a coin-flip is taken to be a “good” year for active managers, then 2022 was a “good” year. But there were also fewer excuses for underperformance, and the long-term record suggests that the swallow of 2022 performance does not an active summer make.


The posts on this blog are opinions, not advice. Please read our Disclaimers.

International Women’s Day Embraces Equity

Contributor Image
Barbara Velado

Senior Analyst, Research & Design, Sustainability Indices

S&P Dow Jones Indices

March 8th marks International Women’s Day, an event that honors and celebrates women worldwide and that has been observed for over a century. This year’s theme is Embracing Equity, and it highlights the fundamental difference between equality and equity. While these words are often used interchangeably, the former means giving everyone equal opportunities, while the latter recognizes specific circumstances when allocating resources to achieve equal outcomes. But how close are companies to attaining true gender parity?

The Road to Gender Balance

Not only is there an ethical case for gender parity, but also an economic one: enhanced female representation in the workplace could add USD 12 trillion to global GDP.1 Studies show the added benefits of corporate gender diversity, from entry-level to senior positions, leading to productivity and innovation gains.2 Regulation proposals aimed at increasing gender balance are growing, with the EU adopting minimum targets for corporate boards.3 Despite the progress, the road to gender balance is a long one—the World Economic Forum (WEF) estimates that it will take 132 years to close the gender gap.4

We explore the share of women in the workforce across regional indices, within management positions and at the board level, as well as the total number of women employed across all functions5 (see Exhibit 1). The U.K. is the only region where women cross the 40% threshold for board membership and across total workforce, with Europe and the U.S. closely following. Within the S&P 500®, women represent 39% of total workforce roles and close to 33% of board appointments.

While weighted averages are helpful, they might not paint the full picture. We examine the distribution of female representation across three functions within the S&P 500. Management and board positions’ frequency distribution tends to be centered around lower percentages of women appointments (see Exhibit 2).

Looking at the S&P 500 from a sectoral perspective, Health Care and Financials lead the charts, with women representing at least 50% of total workforce, having reached gender parity (see Exhibit 3). Conversely, Materials and Energy are the least gender-diverse sectors. It is worth noting the sectoral dispersion between total workforce and boards’ women composition. The difference between most and least diverse sectors for board membership is 7.6%, while for total workforce is 31%.

Retaining Women Talent

Not only are women still underrepresented across most corporate ladder levels, they are also leaving companies at an alarming rate relative to their male counterparts.6 Talent retention is increasingly important for women’s career advancement. Employee support programs, such as paid parental leave, flexible working and hybrid arrangements, can be highly beneficial. More than 45% of companies within the S&P 500 adopt flexible working and 40% have paid maternity leave (more than legally required), but only 32% offer paid non-primary parental leave (see Exhibit 4).

Going beyond equal opportunities and creating equal outcomes requires recognizing heterogeneity of women’s characteristics and circumstances, in order to remove systemic barriers that hinder long-term success. Data from the S&P Global Corporate Sustainability Assessment (CSA)7 suggests that workplace gender gaps persist across regions, sectors and managerial positions. There is more to do to bring and retain women in the workplace and empower them to attain their full potential. The benefits of doing so are vast and contribute to the UN’s Sustainable Development Goals’ agenda on Gender Equality.

1 McKinsey Global Institute gender report.

2  Harvard Business Review Research 2019.

3 European Commission announcement.

4  WEF Global Gender Gap Report 2022.

5  Management positions span junior, middle and senior management roles. Datapoints included in analysis have at least 80% coverage by weight.

6 Women in the Workplace Report 2022 within corporate America

7 More information on CSA here.

The posts on this blog are opinions, not advice. Please read our Disclaimers.