Get Indexology® Blog updates via email.

In This List

Commodities Outperform for the Second Year in a Row

Defending with S&P Dividend Growers

A Lackluster 2022 for Canadian Equities

Safe Harbors and Silver Linings

Paying Dividends: Measuring Rising Income against Declining Risks in the iBoxx Fixed Income Indices

Commodities Outperform for the Second Year in a Row

Contributor Image
Fiona Boal

Managing Director, Global Head of Equities

S&P Dow Jones Indices

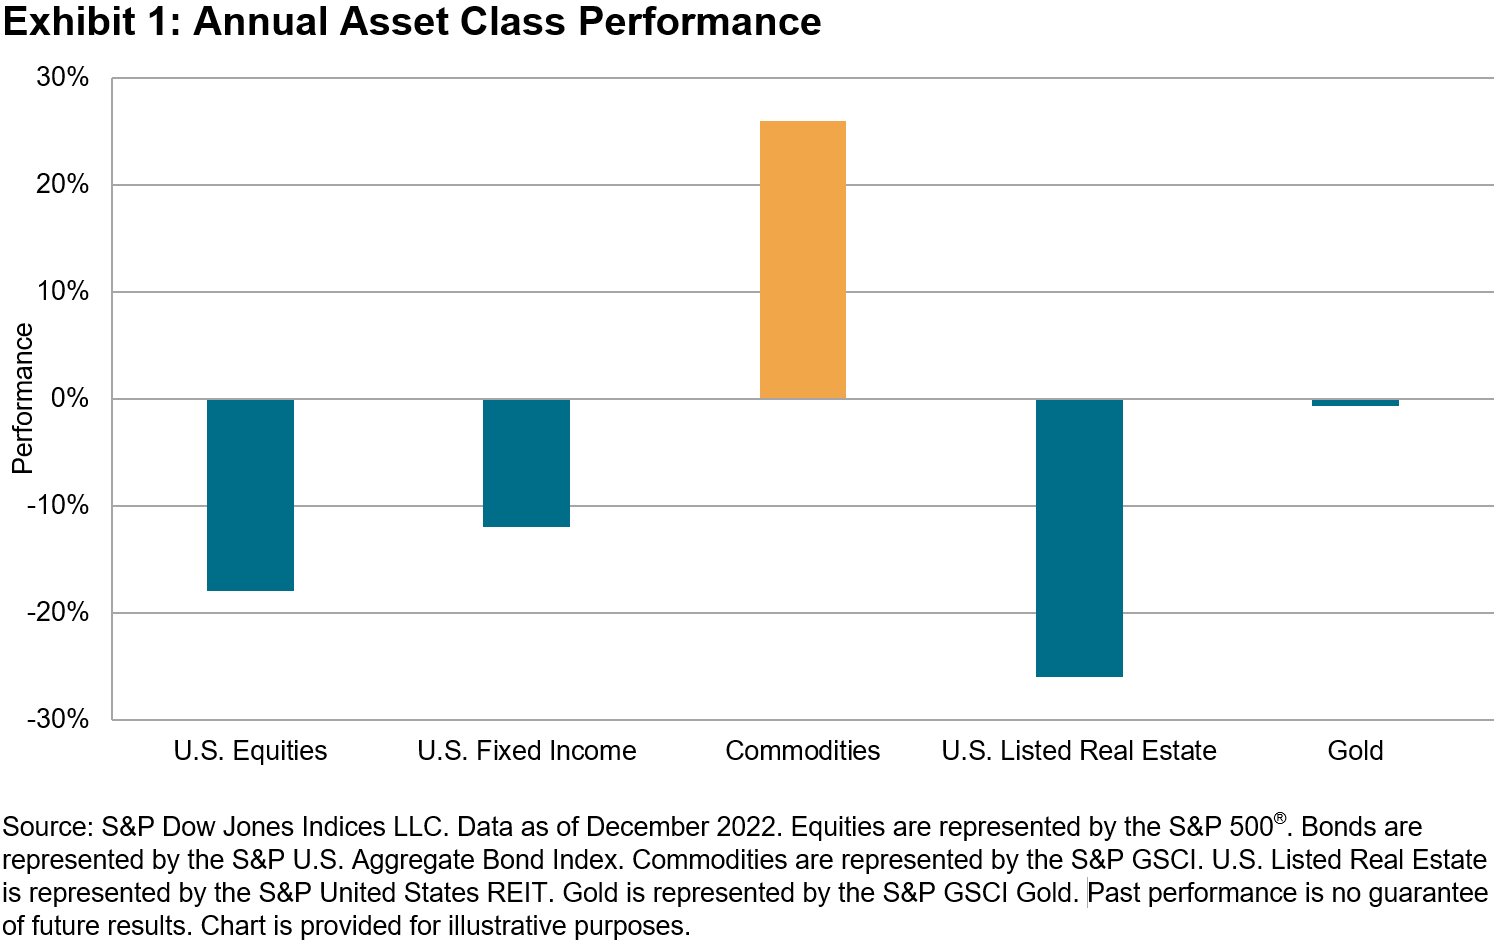
The market standard commodities benchmark, the S&P GSCI, performed admirably in 2022, rising 26%, outpacing other commodities indices and asset classes, as well as defying higher interest rates and growing fears of a prolonged global economic slowdown, while high inflation provided a solid backdrop for one of the most inflation-sensitive asset classes. Commodities has been the best-performing major asset class for each of the past two years.

It is not surprising that the energy complex enjoyed the strongest performance across commodities markets in 2022, with the S&P GSCI Petroleum rallying 44.6%. Oil prices surged in March as the Russia-Ukraine conflict disrupted global oil trade flows, but prices reversed in the second half of the year as recession risks multiplied. At the end of December, Russia delivered its long-awaited response to the Western price cap, announcing that it would ban the supply of oil and oil products for five months to countries that are party to the cap, starting on Feb. 1, 2023.

It was a wild ride for natural gas in 2022; the S&P GSCI Natural Gas ended the year up 19.8%, following a decline of 33.5% in December. Supply disruptions due to the Russia-Ukraine conflict sent global gas markets into override, but prices have more than halved since their mid-year highs, with stronger U.S. production and milder weather contributing to the reversal.

Despite starting the year with solid gains, industrial metals ended the year in negative territory, with the S&P GSCI Industrial Metals declining 7.6%. Inflation, COVID-19 lockdowns in top consumer China and coordinated interest rate rises hampered economic growth and weakened demand for industrial metals used in the power and construction industries, such as copper. 2022 will also be remembered as the year that the nickel market was rocked by a period of disorderly trade on the LME, leading to elevated periods of volatility and a slump in liquidity.

Performance across the agricultural markets was mixed. An ongoing drought in top soybean meal exporter Argentina and less competition from alternative oils such as sunflower and palm supported soybean prices, with the S&P GSCI Soybean ending the year up 28.9%. Wheat prices jumped to an all-time high following the Russian-Ukraine conflict (both major exporters of wheat). However, Black Sea exports picked up in the second half of the year, helped by a deal to create a safe shipping corridor for Ukrainian wheat and a record Russian harvest, ensuring that the S&P GSCI Wheat ended the year down 2.7%. Sugar racked up its fourth consecutive year of annual gains, while caffeine fans should be heartened by the fact that coffee was the worst performer in the S&P GSCI in 2022, falling 21.9%.

With the USD posting its biggest annual gain since 2015 and interest rates rising, it was no surprise that the yellow metal had a lackluster year. The S&P GSCI Gold ended 2022 down a little less than 1.0%. That said, gold performed admirably in the final few months of the year on expectations that the U.S. Fed could begin to scale back the pace of its interest rate hikes, strong central bank purchases and the ongoing challenges in the cryptocurrency ecosystem.

The S&P GSCI Livestock eked out a gain of 4.8% in 2022. Lean hogs were the best performer, benefitting from tight supplies and less competition from poultry.

To learn more about the S&P GSCI and related indices, check out our Commodities Theme Page.


The posts on this blog are opinions, not advice. Please read our Disclaimers.

Defending with S&P Dividend Growers

How does constructing high capacity indices focusing on stable dividend growers and excluding potential value traps, tend to lead to higher profitability, reduced volatility, and greater risk-adjusted performance than the benchmark? S&P DJI’s Pavel Vaynshtok, Vanguard’s Janel Jackson, and MJP Wealth Advisors’ Brian Vendig take a closer look at the S&P Dividend Grower Indices.

The posts on this blog are opinions, not advice. Please read our Disclaimers.

A Lackluster 2022 for Canadian Equities

Contributor Image
Fei Mei Chan

Former Director, Core Product Management

S&P Dow Jones Indices

With less than two weeks remaining in 2022, the S&P/TSX Composite Index is down 5.7% YTD (a relatively mild decline compared to the S&P 500®’s 17.9% drop). The S&P/TSX Composite Low Volatility Index has underperformed, which is unusual for a down year, falling by 9.6% YTD.

Volatility continued its uptrend since the last rebalance, rising for every sector of the S&P/TSX Composite Index. Materials and Utilities were among the sectors with the biggest hike in one-year volatility, up 5% and 4%, respectively.

Not surprisingly, the latest rebalance for the S&P/TSX Composite Low Volatility Index scaled back its weight in Utilities. (The index has had zero weight in Materials since its December 2021 rebalance.) Real Estate also pared its weight, while the remaining sectors all increased their presence, with Industrials taking up most of the slack. The latest rebalance took effect at the close of trading on Dec. 16, 2022.

The posts on this blog are opinions, not advice. Please read our Disclaimers.

Safe Harbors and Silver Linings

Contributor Image
Anu Ganti

U.S. Head of Index Investment Strategy

S&P Dow Jones Indices

As we reflect on this year’s notable market themes, one trend is certain: it has been a tumultuous market characterized by rate hikes and inflation concerns across regions, with significant losses across asset classes. Crypto market performance added to jitters, with the S&P Cryptocurrency LargeCap Index down 66% YTD. Losses throughout the year culminated in the collapse of FTX, one of the largest global cryptocurrency exchanges, as a result of its founder’s recent fraud allegations. A turnaround in broad market equities that began in October provided much-needed relief, with easing inflation and optimism surrounding a potential slowing pace of U.S. rate hikes, but the S&P 500® has still declined by 15% YTD.

Meanwhile, U.S. Treasuries are on track for their worst year on record, with the S&P U.S. Treasury Bond Index down 9%. As a result, correlations between U.S. equities and bonds turned positive, which last occurred during the second quarter of 2021, as Exhibit 1 illustrates. Corporates and high yield bonds also suffered, with the iBoxx USD Liquid Investment Grade Index and iBoxx USD Liquid High Yield Index down 15% and 8%, respectively. The combined underperformance of equities and bonds meant record losses for the traditional 60/40 portfolio. Other regions were not spared, and the U.K. bond market downturn taught us the importance of liquidity, which can be hard to find when it most needed. Another consequence of rising rates along with safe-haven demand globally was the rally in the U.S. dollar.

Investors’ search for income led to renewed interest in dividend and low volatility strategies, with the S&P 500 Low Volatility High Dividend Index significantly outperforming the benchmark. Additional safe harbors came from value strategies, which have outperformed growth in the U.S. and globally after decades of underperformance. After years of mega-cap dominance, further reversals came with the strength of smaller caps, boosting the performance of S&P 500 Equal Weight Index.

Emerging market equities offered little solace, with the S&P Emerging BMI down 17% YTD, although a rebound in the final quarter was aided by optimism in the U.S., a pullback in the dollar and especially the rebound in China equities as a result of the potential move away from strict pandemic policies. The swings in Chinese equity performance make their diversification properties interesting to analyze. In Exhibit 2, we calculate the spread in trailing 12-month volatility between the S&P Emerging BMI versus S&P Emerging Ex-China BMI. When this spread is positive, the inclusion of the country increases volatility in the benchmark; when negative, the country acts as a diversifier. Note the positive spread for China since March 2021, highlighting China’s switch from a volatility diversifier to a volatility amplifier, as the country’s fortunes have increasingly been tied to the rest of the emerging markets.

Unsurprisingly, as macro headwinds whipsawed markets, volatility rose.  Index dispersion remained elevated, potentially leading to relatively better U.S. large-cap fund outperformance in the first half of the year by creating greater opportunities to add value from stock selection. Volatility also manifested itself in the rising differences among global sectors and countries that we see in Exhibit 3, which implies greater potential opportunities to add value from sector and country allocation. The S&P Global 1200 Energy led among sectors with a YTD gain of 46%, driven by the surge in oil prices from supply shocks, including the Russia-Ukraine conflict and companies’ increased willingness to participate in the energy transition. In contrast to China, Energy, despite being the most volatile sector, has acted as a volatility diversifier.

As uncertainty over the future global economic outlook lingers, with concerns around Q4 corporate earnings, a record inversion between 2- and 10-year Treasury yields, alongside a backdrop of geopolitical tensions, forecasting the market outcome for 2023 may be a futile exercise. But a couple of silver linings are worth noting: the torrid losses in fixed income have made bonds more attractive with relatively high current yields, particularly in the emerging markets and high yield space. As far as equities are concerned, U.S. history might offer a glimmer of hope, with Exhibit 4 showing that since 1936, of the nine prior years with double-digit losses, seven of those years experienced double-digit gains the following year, proof that the best guess of future returns does not depend on the immediate past.

The posts on this blog are opinions, not advice. Please read our Disclaimers.

Paying Dividends: Measuring Rising Income against Declining Risks in the iBoxx Fixed Income Indices

Contributor Image
Brian Luke

Senior Director, Head of Commodities, Real & Digital Assets

S&P Dow Jones Indices

With the ZIRP world1 firmly in the rear view, the “income” in fixed income is back. As yields collapsed to record lows, income-starved investors sought alternative sources of income such as dividend strategies, which attracted record flows in related products throughout 2022. Now, with investment grade bond yields hitting as high as 6%, bonds are back to offering compelling income opportunities.

In addition to enhanced income, we analyze common risk signals such as credit spread, liquidity and interest rate risk to assess the current state of the bond market. Placing index attributes in a historical context, risk factors indicate stabilizing spreads and liquidity with declining interest rate risk in the broad indices. Lastly, we compare bond yields to alternative sources of income, with higher breakeven inflation yields offered in Treasury bonds compared to dividend yields in the S&P 500.

After more than a decade of investment grade corporations paying an average of 3.6%, and never more than 5%, yields on the iBoxx $ Liquid Investment Corporate Bond Index reached as high as 6.31% this summer, a nearly 4 standard deviation move from its 10-year average, before settling in the mid-5% range. While 3 standard deviation moves are rare, a move of 4 standard deviations enters “black swan” territory. Simply put, investment grade bond yields have not been this high since the aftermath of the credit crisis. Further, the spreads offered in excess of Treasuries by the iBoxx $ Liquid Investment Grade Corporate Bond Index are trading around the 10-year average of 150 bps and far from the 380 bps seen during the COVID-induced sell-off, suggesting historically high yields are not a result of degrading credit quality and the impact on rising rates is contained to the Treasury market.

During times of stress, volatility can adversely affect liquidity, particularly in fixed income. Treasury market liquidity has declined by an average of 0.1 bps of yield this year compared to 2021. The average bid/ask yields of the iBoxx Treasury Bond Index YTD rose to an average of 0.45 bps from 0.35 bps in 2021. Conversely, the liquidity of the iBoxx $ Liquid Investment Grade Corporate Bond Index has remained relatively stable by virtue of the index methodology selecting the most traded bonds, with the average bid/offer spread well below pandemic highs, an advantage magnified during stressed markets.

While current yields appear attractive on a historical basis and relative to dividends, potential risk remains inherent in fixed income. A bond’s sensitivity to rising rates is best measured through its duration, for every given unit of duration magnifies the negative impact on prices when yields rise. Throughout the pandemic, corporate officers took advantage of low borrowing costs to raise debt and extend the duration of their loans, thereby extending overall index duration and increasing sensitivity to interest rate increases. As borrowing dropped and debt supply dropped, duration fell back to historical levels. The iBoxx $ Liquid Investment Grade Corporate Bond Index duration has shed by over a year in 2022 and is now slightly below its long-term average. With a lower duration profile, the index is less sensitive to potential rate shocks going forward.

When compared on a real (inflation-adjusted) basis, it appears bonds are offering income well in excess of those offered by many stocks. The S&P U.S. TIPS 10-Year Index represents the real yield offered by the market. Indicative dividend yields of stocks in the S&P 500® are at their lowest level in at least a decade, while the yield premium of IBOXIG yields are their highest in at least a decade.

As the Fed combats inflation to stabilize the economy, assets including fixed income and growth stocks are adversely affected. While many have flocked to dividend strategies, fixed income remains attractive as a traditional, non-alternative, source of income. Improved liquidity through proper index construction, combined with declining interest rate risk, can potentially reduce risks that plagued previous time periods. Bonds may be back, and through an index lens, are looking better and better.

1 ZIRP refers to global central banks pursuing a zero-interest rate policy (ZIRP)

The posts on this blog are opinions, not advice. Please read our Disclaimers.