Get Indexology® Blog updates via email.

In This List

Large Caps Lag In Rebounds

Value Versus Growth: A Sector Perspective

The Future of Iron Ore Indices

Getting to Know the S&P/BMV IPC – An Iconic Representation of the Mexican Equity Market

Momentum for a Low-Carbon Economy – A Postcard From Poland

Large Caps Lag In Rebounds

Contributor Image
Jodie Gunzberg

Former Managing Director, Head of U.S. Equities

S&P Dow Jones Indices

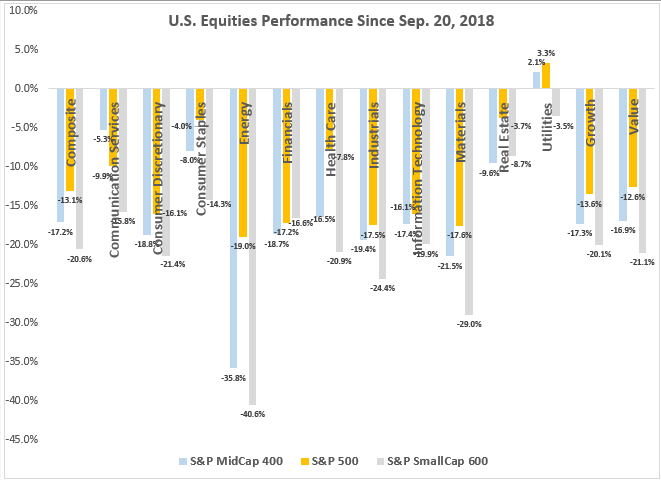
The entire U.S, equity market lost on Monday, Dec. 17, 2018, meaning every one of the 42 segments by size, sector and style finished negative for the day.  This was the second day in a row with losses across the board.  From Oct. 10-11, 2018 was the last time two consecutive days with all losses occurred.  Now every segment of the U.S. equity market is negative in December (month-to-date through Dec. 17, 2018.)  Only 9 times in history has every segment of the U.S. equity market lost in a month (with all sector data starting in 1995 and style data in 1997.)   Those months were Aug. 2015, Sep. 2011, May and Jun. 2010, Jan. and Feb. 2009, Oct. 2008, and Jul. and Sep, 2002.

The only sectors that are still positive in 2018 (year-to-date ending Dec. 17, 2018) are health care and utilities, though health care has experienced some of the worst returns in the month dropping 13.1%, 11.3% and 8.4% for small-, mid- and large-caps, respectively.  Volatility remains high across the sizes, though mid-cap 30-day annualized volatility has fallen below 20%, which hasn’t happened for small-caps since Oct. 24, 2018 and large-caps since Nov. 2, 2018.  Many uncertainties have been driving the volatility in U.S. equities including the interest rate decision, trading tensions, Brexit, and other soft economic data like slower housing, and weaker-than-expected economic data out of China and the eurozone.

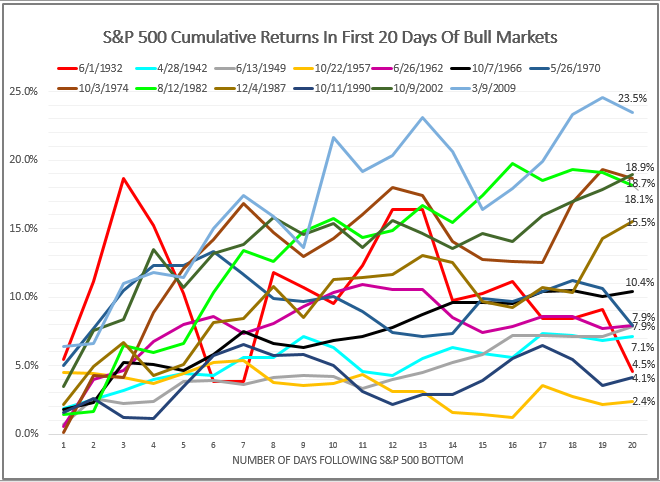
On average, S&P 500 bear markets lose 36.0%, ranging between the least severe bear market loss of 19.9% before the 1990 bull market, and the biggest decline of 60.0% before the 1942 bull market.  The last two bear markets lost 56.8% in the global financial crisis and 49.1% in the tech bubble burst.  While this drop since Sep. 20, 2018 may feel painful, the S&P 500 has further to fall before it reaches bear market status of a 20% drop.  As of now, only the S&P SmallCap 600 has entered a bear market defined by its 20% loss.

Source: S&P Dow Jones Indices. Data ending Dec. 17, 2018.

While it is possible, stocks may decline further, it is important to remember that timing the market is difficult.  However, the returns in the first days of a bull market are historically big on average, so it is important to try not to miss them.  After just 3 days, the S&P 500 average return was 6.6%, and after 5, 10 and 20 days, the respective returns on average were 7.5%, 10.3% and 11.3%.  Also, in 5 of 13 years (1932, 1970, 1974, 2002 and 2009,) returns of 10% or more were measured after just 5 days.

Source: S&P Dow Jones Indices

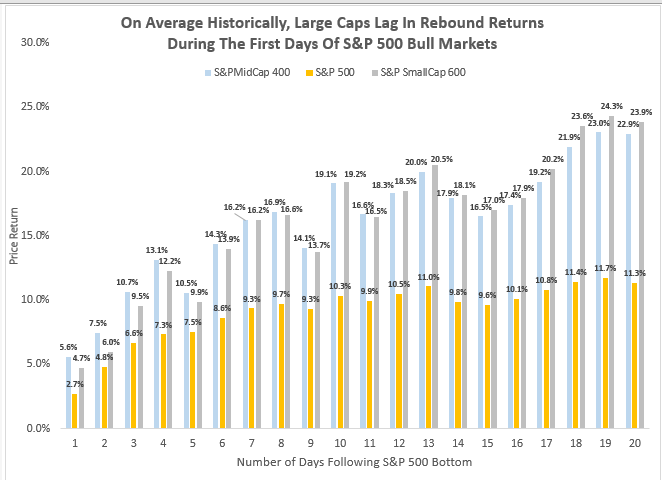
Within the U.S. equity complex, the positioning matters to capture the upside in those first few days of a rebound.  Notice in just the first four days, both the mid- and small-caps returned  double digits on average.  Historically, in the first nine days of an S&P 500 bull market, the S&P MidCap 400 has returned the most on average, though the S&P SmallCap 600 pulled ahead after the 10th day.  More importantly, the large caps, represented by the S&P 500 distinctly lag.  After 20 days, the S&P 500 has returned on average just 11.3% versus 22.9% and 23.9% for mid- and large- caps, respectively.  Possible reasons can be how sensitive mid- and small-caps are to growth, the dollar, inflation or interest rates.  Moreover, mid-caps may do well in these first bull-market days since they are generally not as risky as smaller companies, yet have solid infrastructure but are nimble enough to take advantage of opportunities, especially overseas if the dollar drops.

Source: S&P Dow Jones Indices

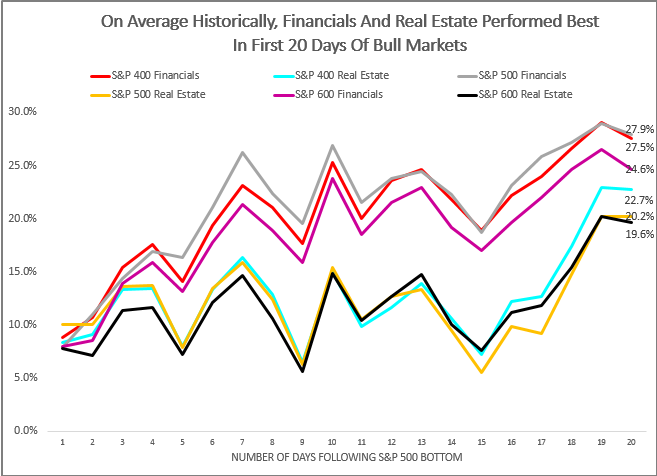
Further, regardless of size, the financial and real estate sectors have done best on average in the first days of a new bull.  Every size of these sectors develop into a bull market in the first 20 days on average after S&P 500 bottoms with large- and mid-cap financials returning nearly 28%.  Even in just the first 3 days, the average returns of these segments were between 11.3% and 15.4%.

Source: S&P Dow Jones Indices

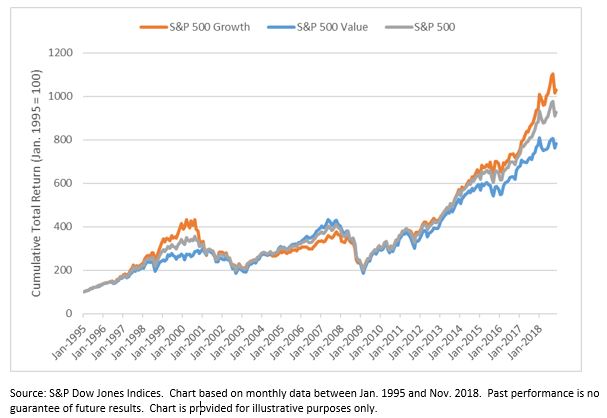
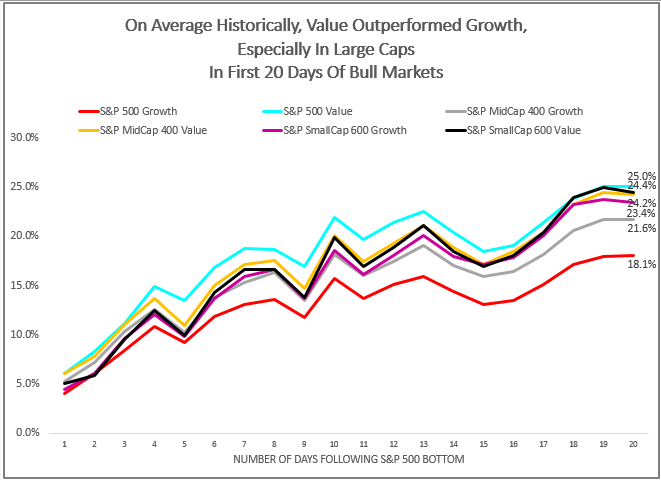
Lastly, if large caps are the size of choice, the value style helped, but style really only mattered for large caps with the S&P 500 Value posting a 25.0% average return versus 18.1% for the S&P 500 Growth.

Source: S&P Dow Jones Indices

Again, with the high levels of volatility in the market today as a result of several unknown events, there is a possibility of a further decline but the bottom will likely be difficult to time.  Given the risk, the only way to be certain of earning the potentially big returns in the rebound is to be invested.  Throughout the U.S. equity market, the returns in early bull market days have been significant, but historically, the mid- and small-caps have done better.

The posts on this blog are opinions, not advice. Please read our Disclaimers.

Value Versus Growth: A Sector Perspective

Contributor Image
Hamish Preston

Head of U.S. Equities

S&P Dow Jones Indices

One of the most persistent trends over the last decade has been the underperformance of value compared to growth.  The S&P 500 Growth beat its Value counterpart in eight of the last ten full calendar years, and growth is currently on track to outperform in 2018 (you can find year-to-date figures on page four of our daily dashboard).

Exhibit 1: Growth has outperformed over the last decade

Although the trend remains intact so far in 2018, a recent uptick in volatility left many investors wondering if value might be in line for a comeback.  Indeed, value outperformed in October and November as many growth-oriented stocks came under pressure from investors looking to take risk off the table.  While it remains to be seen if this nascent trend is here to stay, historical sector exposures may be useful for assessing the relative prospects of growth and value.

Exhibit 2 shows that Financials and Tech were usually the largest sectors in the value and growth indices, respectively.  This result held across all three time frames, capturing 1) the run-up to the height of the Tech bubble (Jan. 1995 to Mar. 2000); 2) the subsequent bursting of that bubble and the run-up to the Global Financial Crisis (Apr. 2000 to Dec. 2007); and 3) the Global Financial Crisis and the most recent bull market in U.S. equities (Jan. 2008 to Nov. 2018).

Exhibit 2: Average Sector Weights in the S&P 500 Value and S&P 500 Growth

Given their large weights in the factor-based indices, it is perhaps unsurprising that the contributions to returns from Financials and Tech were important for understanding the performance of value and growth.  For example, Tech contributed most positively to the S&P 500 Growth in the most recent period and in run-up to the height of the Tech Bubble, but it weighed most heavily as the bubble burst.  Similarly, Financials was the largest contributor to the S&P 500 Value in the late 1990s and early 2000s, but has been the biggest drag on the value index since the start of 2008.

As a result, there has been much discussion (including in one of our recent videos) about whether the last couple of months represent a style shift in U.S. equities.  While it remains to be seen if value is in line for a comeback, history suggests that the (expected) performance of the Tech and Financials sectors could be useful considerations when trying to predict how these styles may perform.


The posts on this blog are opinions, not advice. Please read our Disclaimers.

The Future of Iron Ore Indices

Contributor Image
Marya Alsati

Former Product Manager, Commodities, Home Prices, and Real Assets

S&P Dow Jones Indices

On Nov. 26, 2018, S&P Dow Jones Indices (S&P DJI) launched the S&P GSCI Iron Ore and the S&P GSCI Industrial Metals & Iron Ore Equal Weight to provide investors exposure to one of the most important industrial commodities in the world. Iron ore is the second-largest commodity market by value after crude oil and is a major industrial component of the world’s second-largest economy, China. The S&P GSCI Iron Ore is benchmarked to the SGX TSI Iron Ore CFR China (62% Fe Fines) Index Futures. The Singapore Exchange (SGX) is the home of international iron ore derivatives, offering Iron Ore CFR China (62% Fe Fines) swaps, futures, and options.

Offering investors an index benchmarked to an iron ore futures contract provides insight into the steel market, as iron ore is the primary raw material used in the production of steel, which is the key material used in construction, ship building, and other heavy manufacturing activities. China has the world’s largest steel industry and is the main importing nation for global seaborne iron ore. China’s crude steel production is forecast to reach a new annual record of 923 million metric tons in 2018,[1] despite ongoing anti-pollution measures to shut down low-grade steel capacity and the ever-evolving China-U.S. trade war. Major iron ore producing countries include Australia and Brazil, where iron ore production and prices can have a significant impact on economic growth, terms of trade, and local currency fluctuations. The introduction of the S&P GSCI Iron Ore and S&P GSCI Industrial Metals & Iron Ore Equal Weight opens up this investment universe to global investors.

Exhibit 1 depicts the summary statistics of the performance of iron ore compared with the commodities included in the industrial metals sectors.

While iron ore is defined as an industrial metal according to S&P DJI’s commodity sector definition, the futures contracts behind the other industrial metals indices are for processed or semi-processed metals, while the iron ore contract refers to a raw material. Looking at the three- and five-year returns of the industrial metals commodities, iron ore was the best-performing commodity on a three-year annualized and risk-adjusted return basis, and the second-best performing commodity on a five-year basis after zinc. In terms of correlation, the ferrous metal exhibited the lowest correlation among the industrial metals.

[1]   China Metallurgical Industry Planning and Research Institute.

The posts on this blog are opinions, not advice. Please read our Disclaimers.

Getting to Know the S&P/BMV IPC – An Iconic Representation of the Mexican Equity Market

Contributor Image
Maria Sanchez

Director, Sustainability Index Product Management, U.S. Equity Indices

S&P Dow Jones Indices

2018 marks the 40th anniversary of the S&P/BMV IPC, launched on Oct. 30, 1978, as part of the Mexican market revolution. Honoring that milestone, we revisited the evolution of the index that has since become an icon of the Mexican equity market.[1]

As of Dec. 31, 2017, Mexico had 141 listed domestic companies, with a market capitalization representing roughly 36.26% of the Mexican gross domestic product (GDP).[2] The 35 constituents of the S&P/BMV IPC amounted to approximately USD 295,450 million[3] in market capitalization, capturing nearly 70.61% of the listed equity market.

The S&P/BMV IPC has represented a sizable portion of the Mexican economy, as measured by the GDP (see Exhibit 1). From 1978 to 2017, the average market capitalization of listed domestic companies accounted for about 22% of the country’s GDP, reaching a maximum of 44.24% in 2012.

The main objective of the S&P/BMV IPC is to measure the performance of the largest and most liquid stocks listed on the Bolsa Mexicana de Valores (BMV). Based on historical 10-year figures, the S&P/BMV IPC captured about 80% of the market capitalization on average. Exhibit 2 shows a comparison of the market capitalization of the constituents of the S&P/BMV IPC versus the S&P Mexico BMI (MXN), which is another broad-based benchmark from the S&P BMI Series and is designed to measure the performance of the Mexican equity market.

During the past four decades, the S&P/BMV IPC has played an important role, serving as a barometer for the Mexican capital market. Since its launch, the structure and characteristics of the index have evolved gradually, while keeping the primary objective of measuring the performance of the largest and most liquid stocks listed on the BMV. In subsequent blog posts, we will explore its evolution in greater depth.

[1]   For more information, see The S&P/BMV IPC Turns 40.

[2]   World Development Indicators Database Archives as of Nov. 14, 2018.

[3]   Using the foreign exchange rate in U.S. dollars against Mexican pesos, disclosed by the World Federation of Exchanges.

The posts on this blog are opinions, not advice. Please read our Disclaimers.

Momentum for a Low-Carbon Economy – A Postcard From Poland

Contributor Image
Hannah Skeates

Former Senior Director, ESG Indices

S&P Dow Jones Indices

It is now three years since the historic events at the UN Climate Conference in Paris in December 2015. At that event, with much relief and emotion, the countries of the world came together to agree that global emissions should be limited. We would collectively seek to contain the temperature rise to within 2 degrees Celsius from pre-industrial levels—thereby hopefully avoiding the worst implications of catastrophic climate change.

In the past three years, we have experienced ever more obvious changes to our physical climate across the world. Dramatic weather events are hitting frequently, whether storms or water shortages. In addition to the climate change effects of greenhouse gases, our increasing global urbanization, combined with reliance on fossil fuels, has created many pollution hotspots that are socially unsustainable. Furthermore, the Intergovernmental Panel on Climate Change has recently suggested that 2 degrees is not low enough—we need to aim for a rise of just 1.5 degrees.[1]

So here at COP24, the UN’s 2018 climate talks taking place in Katowice, Poland from Dec. 3-14, 2018, the focus is on how to get on track to a low- (or zero-) carbon economy. For this to happen, emissions must peak rapidly and then reduce. Information must be available to investors so that they can make climate-conscious decisions about how they allocate their capital—aware of the goal and aware of the transition-related risks and opportunities.

While the speed of change may not yet be fast enough, action is being taken. Ireland is removing its high-carbon investments via its Fossil Fuel Divestment Bill.[2] South Africa has introduced a carbon tax bill that notes “the costs of remedying pollution, environmental degradation and consequent adverse health effects … must be paid for by those responsible for harming the environment (the polluter pays principle),”[3] and the European Commission has called for a climate-neutral Europe by 2050, with a strategy based on “investing into realistic technological solutions, empowering citizens, and aligning action in key areas such as industrial policy, finance, or research – while ensuring social fairness for a just transition.”[4] Energy companies themselves have started to make significant announcements about their emissions-reducing intentions; Royal Dutch Shell and Xcel Energy have both stated new carbon targets since the UN conference began.

These types of structural changes have direct implications for investors. Many large asset owners have long been aware of the need to align their portfolios with their beneficiaries’ long-term interests, and now these implications are reverberating in asset management and in the banking industry at large.

The world’s largest pension fund, the Government Pension Investment Fund for Japan (GPIF), recently selected two new S&P Carbon Efficient Indices to serve as benchmarks within their ESG investment strategy.[5] These indices sit alongside other carbon-related ones, such as the S&P Fossil Fuel Free Indices or the S&P Carbon Price Risk Adjusted Indices, which integrate the potential risk of future carbon pricing on companies’ possible future market value.

Back in Poland, and according to a recent UN Emissions Gap report,[6] the trajectory could still imply a 3.4°C temperature rise this century—something that the conversations happening in Katowice are looking to change, and fast.

[1]   https://unfccc.int/process-and-meetings/the-paris-agreement/the-paris-agreement

[2]   https://www.oireachtas.ie/en/bills/bill/2016/103/

[3]  http://www.treasury.gov.za/public%20comments/CarbonTaxBll2017/Draft%20Carbon%20Tax%20Bill%20December%202017.pdf

[4]   https://ec.europa.eu/clima/policies/strategies/2050_en

[5]   https://www.prnewswire.com/news-releases/gpif-worlds-largest-pension-fund-selects-new-environmental-indices-launched-by-sp-dow-jones-indices-300718033.html

[6]   https://www.unenvironment.org/resources/emissions-gap-report-2018

The posts on this blog are opinions, not advice. Please read our Disclaimers.