Following an index announcement stating Nektar (NKTR) among other stocks would be moving to the S&P 500 prior to the open on March 19, 2018, an inquiry came in about the index impact of NKTR on the S&P SmallCap 600 Health Care Index performance. Given the stock rose over 70% in 2018, it seemed reasonable to ask about how one company can influence a market cap-weighted index.
In order to answer this question, the weights and returns of each constituent in the index were measured for a contribution to return. For this particular analysis, data from Jan. 2, 2018 through Mar. 16, 2018 was used. Through this time, the weight of NKTR increased from 8.6% to 13.4% with an average weight of 11.4%. The compounded daily index contribution from NKTR was 7.5% to the 16.4% of the S&P 600 Health Care Index. The graph shows the daily index contribution of NKTR (in red), making it clear that the contribution does not rise directly just with the weights or returns but depends on the combination, that in turn depends on the performance of other stocks in the index.
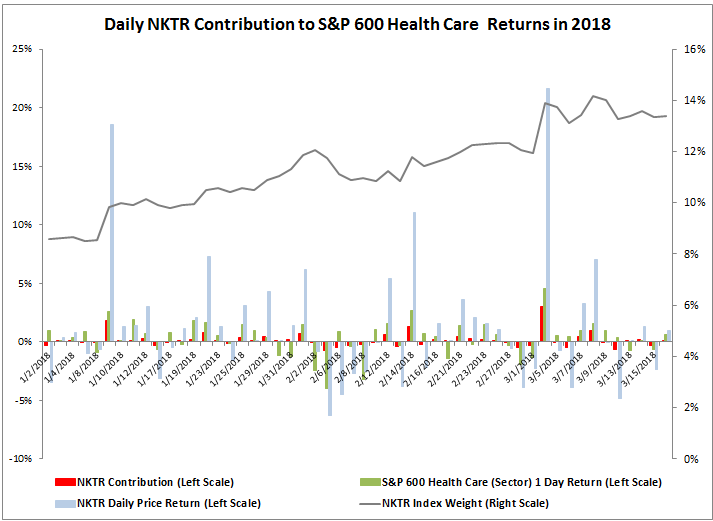
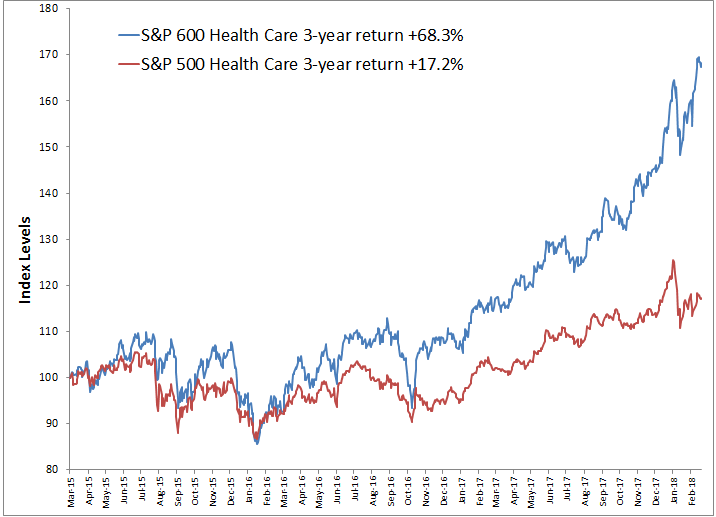
If NKTR, the one stock that rose 70% didn’t drive the whole small-cap health care sector, what else mattered? The index had 78 stocks contributing to the return, of which 64 stocks or 82% (more than 4 of 5) were positive. The worst stocks in the best sectors generally benefit. However, then why have the small caps outperformed the large caps by so much in health care if they are in the same sector?
Looking deeper than the sector level is required to answer this question, and more granular groups by GICS classifications can say a lot about the performance of a sector. When analyzing sector performance using (in order from broadest to narrowest) industry groups, industries and sub-industries, insight can be gained into what is driving a sector and whether a stock is going with its group or if individual fundamentals are at play.
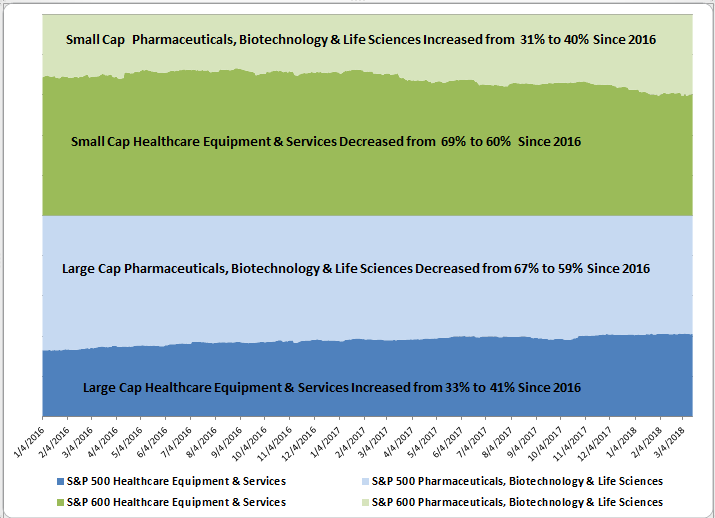
In the case of the health care sector, there are two industry groups, illustrated below with weights in each of large caps and small caps through time. Note that large cap healthcare equipment & services increased through time from 33% to 41% and pharmaceuticals, biotechnology and life sciences decreased in large caps from 67% to 59%. The opposite happened in small caps where the pharmaceuticals, biotechnology and life sciences increased from 31% to 40% while the healthcare equipment & services decreased from 69% to 60%.
Next breaking down the sector weights by industry group, industry and sub-industry shows large cap Health Care Equipment and Managed Health Care are biggest and have grown most from 13.8% to 19.2% and 9.4% to 13.4%, respectively, while the Biotechnology and Pharmaceuticals fell most from 24.3% to 20.6% and 38.4% to 32.2%, respectively. In small caps, the Biotechnology and Pharmaceuticals grew most from 10.1% to 14.3% and 16.9% to 23.2%, respectively. On the other hand in small caps, Health Care Equipment dropped from 25.0% to 10.0% and Health Care Technology fell from 10.1% to 3.9%. Also, in small caps, the Health Care Distributors are almost gone with only Aceto Chemicals left at 0.19%.
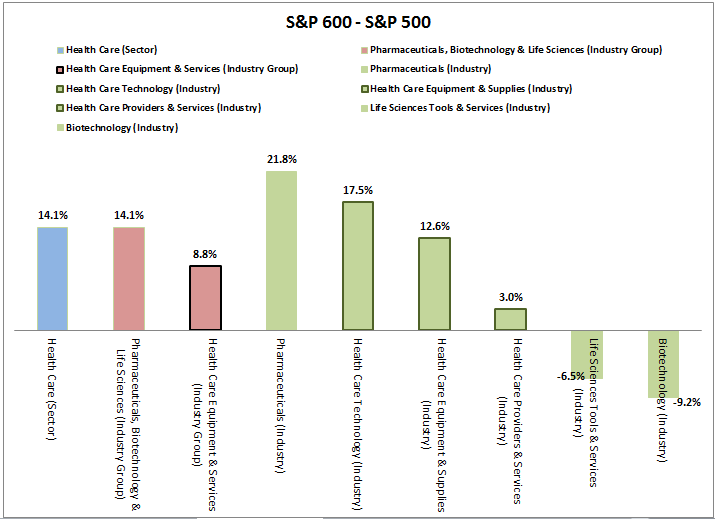
Knowing the weight distribution helps focus where to look for performance contribution. The 3-year annualized return spread of S&P 600 out-performance over the S&P 500 for the health care sector, industry group and industries shows an interesting split. While (very slightly) more of the out-performance came from Pharmaceuticals, Biotechnology & Life Sciences (Industry Group) at 14.1%, all 3 industries from Health Care Equipment & Services (Industry Group) showed a small cap premium. Only Pharmaceuticals did from its broader industry group, but it outperformed by 21.8% annualized over the three years.
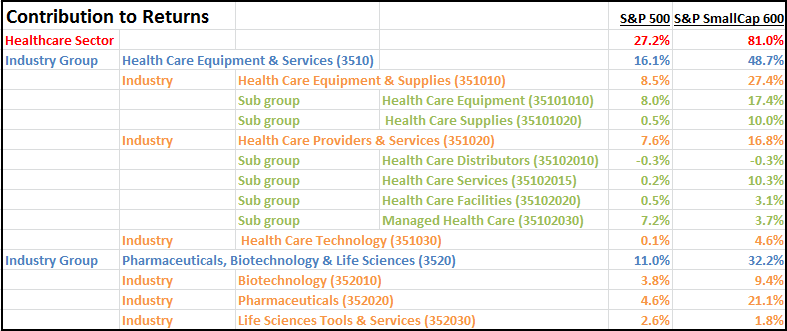
This is the information needed to measure the contribution to returns. Overall the returns of the health care sector were 27.2% and 81.0% for the S&P 500 and S&P 600, respectively. Healthcare Equipment & Services contributed 16.1% and 48.7% to large caps and small caps, respectively – that was more than the Pharmaceuticals, Biotechnology & Life Sciences contribution of 11.0% and 32.2%, respectively, to large and small caps. Healthcare equipment & supplies contributed most of that at 8.5% and 27.4% , respectively for large and small cap. Pharmaceuticals added 21.1% to small caps that was the 2nd most significant industry behind healthcare equipment & supplies.
The result of this sort of deeper sector analysis can lead to understanding the drivers of performance. In this case of small caps outperforming large caps in health care, the credit can be given to deal making, increased expectations for acquisition of smaller companies, stronger innovation from smaller companies and that smaller companies may be more immune to concerns about regulatory pressures in healthcare. These reasons are all mentioned in this article that leads to conclusions about specific stock and ETF choices as ways to benefit from these intra-sector moves.
The posts on this blog are opinions, not advice. Please read our Disclaimers.