


In November, there was high market volatility in response to at least a few major events including the U.S. midterm elections, Brexit, G20 and Fed Chair Powell’s comments. The risk (measured by 30-day annualized volatility) on Nov. 30, 2018 for the S&P 500 was 20.6%, which is 3.5 times higher than its risk of 5.9% on Oct. 9, before the Oct. 10th sell-off, and 1.4 times higher than its average risk of 15.2% (using daily data since Jan. 2, 1991, the earliest common date of the S&P 500 and S&P MidCap 400, through Nov. 30, 2018). While the S&P MidCap 400 risk of 19.1% and S&P SmallCap 600 risk of 21.8% were also elevated ending Nov. 30, 2018, it is interesting to note the large-cap risk was higher than the mid-cap risk. The last November when this happened occurred in 2007.

November 2007 is clearly an interesting point since it was just following the bull market ending on Oct. 9, 2007. This does not necessarily mean the market will decline but it may be time to think about mid-caps since now the premium might be available for less risk. Going back to 1991, when the S&P MidCap 400 was launched, it has delivered on average 3.2% extra of annualized return but at a cost of higher 1.4% annualized risk, based on daily data from Jan. 2, 1991 – Nov. 30, 2018. It seems attractive to have earned that premium but it is not available consistently. Note, over many commonly measured periods, mid-caps underperform large-caps. Though, in November, mid-caps outperformed.
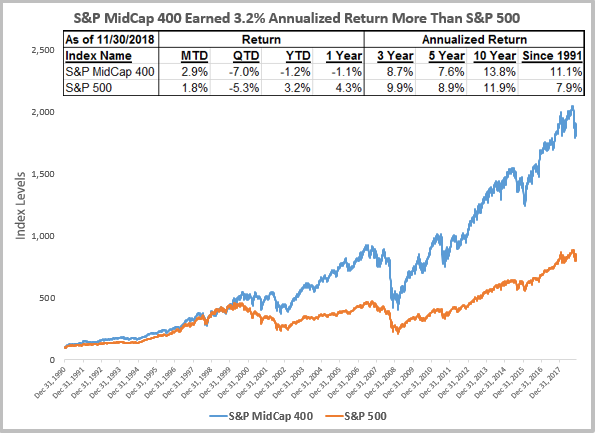
There seem to be moments in mid-caps that are powerful in capturing upside and limiting downside returns of the S&P 500. Overall, the upside capture ratio is 112 while the downside capture ratio is 97. This means, on average, for every 1% increase in the S&P 500, the S&P MidCap 400 gained 1.12%, and also, on average, for every 1% decrease in the S&P 500, the S&P MidCap 400 lost 0.97%. Since 1991, when the S&P 500 had a positive month, it rose 3.0% while in those same months, the S&P MidCap 400 rose 3.4%. During that same time period, when the S&P 500 fell in a month, it lost 3.4% while the S&P MidCap 400 lost 3.3%. In fact, in 88% of months (295/335), both sizes moved in the same direction, magnifying the gains and losses. When both the S&P 500 and S&P MidCap 400 gained, the large-caps were up 3.3% versus 3.9% for mid-caps. However, when both lost, the large-caps fell 3.9% versus 4.2% for mid-caps on average.
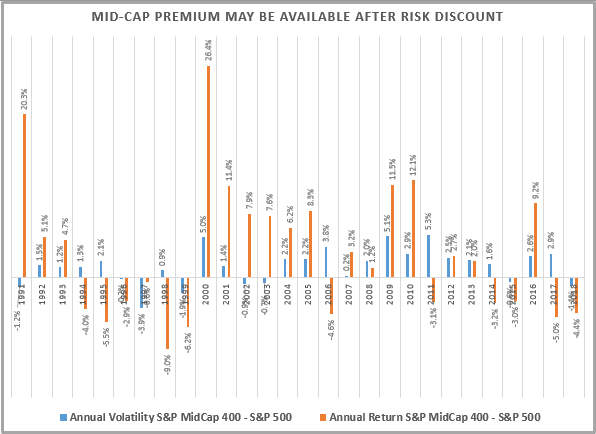
On an annual basis, there have been moments when strong mid-cap premiums appeared, and have been particularly helpful during difficult times such as the financial crisis, the tech bubble bust and the early 1990’s recession. The S&P MidCap 400 outperformed the S&P 500 by 38% from 1991-1993, 81% from 2000-2005 and by 24.1% in 2007-2010. Not only were the premiums big, but in the latter two times, the returns of the S&P 500 were negative 15.0% and 11.3%, respectively, while the S&P MidCap 400 gained 66.0% and 12.8%, respectively. In years after the November 2007 risk discount of mid-caps to large-caps showed up, the mid-cap premium was prominent. It was especially great when the November 1999 risk discount persisted from the preceding October. This appears similar to the current risk discount that is in its second consecutive month.
This November, the S&P 400 gained 2.9% versus the 1.8% from the S&P 500 and the 1.4% from the S&P SmallCap 600. In mid-caps, 9 of 11 sectors were positive, while 8 of 11 large-cap sectors gained and 6 of 11 small-cap sectors gained. Energy in the S&P MidCap 400 was the worst performer, losing 10.2% for the month on the back of a 16.7% loss, making it the worst consecutive 2-month energy sector loss since Dec. 2015 – Jan. 2016. However, the mid-cap consumer discretionary sector rebounded, posting its biggest monthly spread over consumer staples since Sep. 2017, which could be viewed as optimistic.

Finally in November, the S&P 500 had its biggest 3-day gain of 4.23% during November 26-28 since the 3 days ending on June 30, 2016, when the index gained 4.91%. This was largely driven by Powell’s comments and anticipation of improving trade relations from the G20 Summit. While there have been 3-day gains larger than 4.23% only 1.8% of the time (or 436 out of 23,614 instances) in the whole history of the S&P 500 since 1928, many have happened in trending or turning environments. In the past 5 years, 3-day gains have only happened after bottoms (or temporary bottoms.) After the 3-day gain ending December 19, 2014, it was another 216 days until the peak and 249 days before the next bottom. Subsequently, another rebound happened with a 3-day gain of 6.49% ending on August 28, 2015 with 67 days until the next top and 167 days until the next bottom that happened on February 11, 2016 (the index never dropped below that index level afterwards) followed by another big 3-day rebound of 5.43%, ending on February 17, 2016.

There are many factors going into December that are bullish for equities, especially mid-caps. Equities historically perform well on average in December with every size, style and sector gaining. But mid-caps have done best. If trading tensions ease, helping growth and pushing the dollar down, mid caps may be best positioned to perform best based on historical sensitivity. Mid-caps gain most from a 1% dollar drop, rising on average 3.2% versus 2.6% for large-caps. Oftentimes, the falling dollar acts as a catalyst for new international growth and propels returns beyond the mature large-caps. Lastly, the S&P MIdCap 400 has a total return on average of 4.9% versus the S&P 500 total return on average of 4.0% per 1% of historical GDP growth.


