Equities haven’t been the most lovable asset class lately but there are reasons to love them despite these prickly times. The first reason to love equities in rising rate times is that they have gained significantly. Since 1971, the S&P 500 (TR) has gained about 20% on average in rising rate periods, has gained 8 of 9 times and has gained nearly 40% twice with less than a 4% loss for its worst rising rate period. 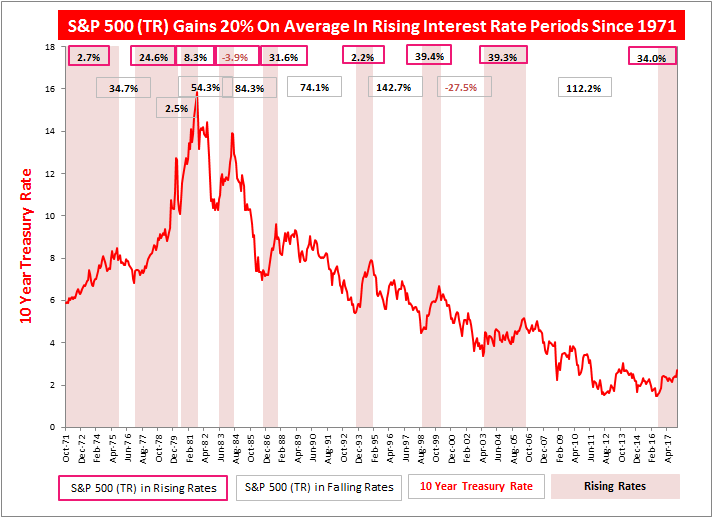 Source: S&P Dow Jones Indices and Federal Reserve Economic Data, Economic Research Division, Federal Reserve Bank of St. Louis. https://fred.stlouisfed.org
While this is less upside than equities have enjoyed in falling rate environments, and some of the equity duration models result in falling asset prices as the discount rate rises, the reality is results can vary. This is since the equity duration is based on a derivative of the dividend discount model that uses long term interest rates plus an equity risk premium, but these models also rely on growth and inflation.
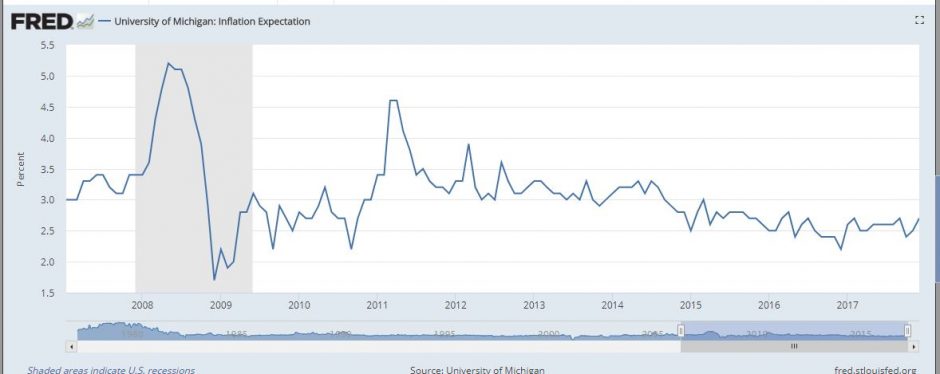
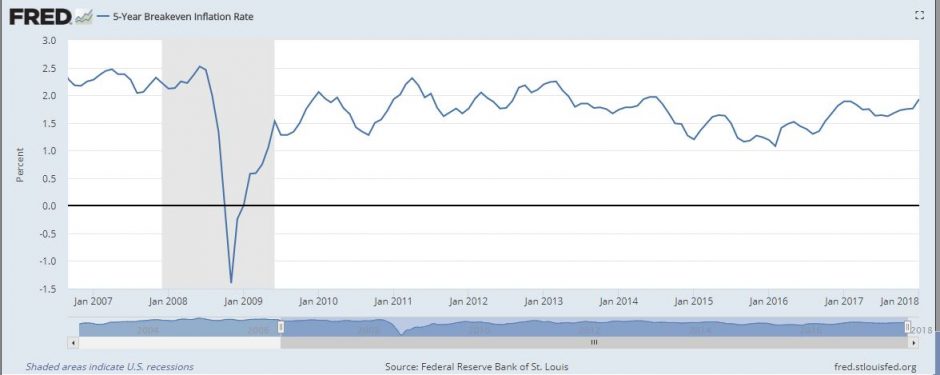
If there is accelerating growth and inflation, like now, rising interest rates can result in appreciating assets, which is the second reason to love equities in this rising rate time. Since the rising rates are happening in a profitable economy with strong growth forecasts and increasing dividend payouts (with an extra boost from the income tax reduction,) the variables impacting the equity duration are moving to love stocks rather than hate them. This makes sense because interest rates may not drive equities but both can rise concurrently from the environment that lifts them.
The third reason to love equities in rising rate environments is that on average for every 100 basis point increase, every single sector, size and style gains. Small-caps led, gaining 7.3% on average for every 100 basis point rate increase, followed by mid-caps that gained 5.9% and large-caps that gained 2.5%. The growth acceleration that cancels the negative equity duration is the same growth that propels small-caps so much, putting them in a leading spot to rise with interest rates – especially since monetary policy is not too tight so that rising interest rates don’t hinder the borrowing by small companies too much. Also, look to the sectors reporting strong profits and paying high dividends to perform in this rising rate environment. As reported in S&P DJI’s Market Attributes in Jan. 2018, 91.3% of Health Care, 83.7% Financial and 88.2% Info Tech companies beat earnings estimates. Also not surprisingly, Utilities, Telecom and Real Estate are the highest yielding sectors. What is interesting is that small-cap financials have a 2.04% yield versus just 1.59% for large and 1.57% for mid cap, but over longer periods of accelerating interest rates, the large-caps do best in the financial sector. This is since as rates rise, margins expand and with accelerating growth plus loose monetary policy, borrowers may be more active and banks can earn more from the spread. 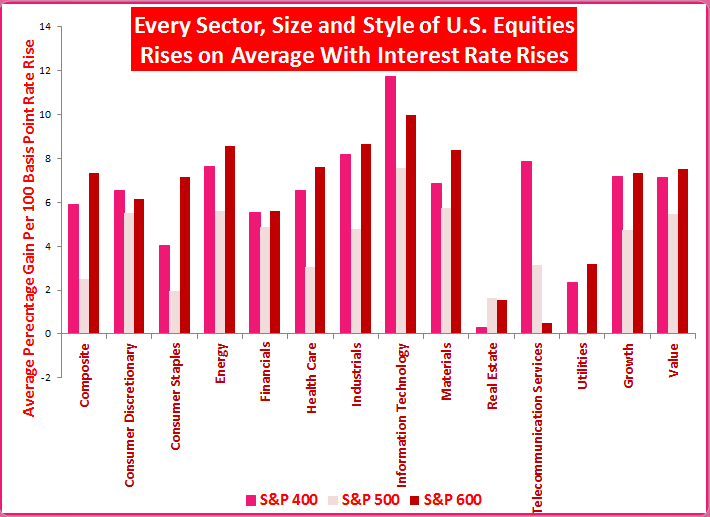 Source: S&P Dow Jones Indices and Federal Reserve Economic Data, Economic Research Division, Federal Reserve Bank of St. Louis. https://fred.stlouisfed.org. S&P 500 from Oct. 1971, S&P 500 Sectors from Oct. 1989, S&P 400 from Aug. 1991, S&P 500 Growth and Value from Feb. 1994, Real Estate Dec. 2001 and all others Jan. 1995.
Overall, this analysis on interest rates that shows support, mainly for small-caps, may help in understanding the macroeconomic impacts of GDP growth, inflation, and the dollar on U.S. equities. There is overwhelming support for small caps followed closely by mid-caps, and for inflation protection, energy seems to be most sensitive.
The posts on this blog are opinions, not advice. Please read our Disclaimers.