Get Indexology® Blog updates via email.

In This List

Myth Busted, Twice: Top 14 of 2014

The Petroleum Puzzle

How Hell Freezes Over

Impact of the Affordable Healthcare Act on Healthcare Cost Trends

Russian Ruble Rebounds (somewhat)

Myth Busted, Twice: Top 14 of 2014

Contributor Image
Jodie Gunzberg

Former Managing Director, Head of U.S. Equities

S&P Dow Jones Indices

Commodities are on track to post one of their worst years in history with the Dow Jones Commodity Index (DJCI) losing 17.3% and the S&P GSCI losing 32.1% through Dec. 29, 2014. According to the DJCI with data back to 1999, only 2001 and 2008 posted bigger losses, down 18.4% and 36.0%, respectively.  In the longer history of the S&P GSCI with data back to 1970, 2014 is set to be the third worst year with bigger losses only in 1998 and 2008 when the returns were -35.8% and 46.5%, respectively.  All sectors lost with the exception of livestock that gained 15.0% in the S&P GSCI and 16.6% in the DJCI.

However, what was unusual about 2014 is that despite the big negative total returns, the both the DJCI and S&P GSCI ended in backwardation for the year. In the history of the S&P GSCI, only twice before has there been two consecutive negative years, 1975-1976 and 1997-1998, but 2013-2014 is the first couple of consecutive negative years in backwardation.  This is important in busting the myth that contango always yields a negative total return and backwardation always yields a positive total return. The spot market determines price return but the storage market determines roll return, so while linked are not perfectly correlated.

In the first half of 2014, 12 commodities, close to a record high of 16 commodities, were in backwardation, only to be followed by a summertime bust that brought the number down to four.  Now, the pendulum has swung towards backwardation again bringing the number back to ten. This reappearance of backwardation shows the mean reverting environment of today that may indicate a turning point.

Following the two times of consecutive negative years, the S&P GSCI returned 115.9% (1977-80) and 111.0% (1999-2000). Further the returns after the years with the biggest losses were 134.8% and 185.0% post 2001 from the S&P GSCI and DJCI, respectively, and 23.7% and 47.9% following 2008 from the S&P GSCI and DJCI, respectively.

The biggest factors to watch influencing commodities for 2015 are likely the strength of the dollar, the geopolitical environment and Chinese demand.  Rising interest rates and inflation, while maybe not an immediate concern to some have been historically good for commodities.

Let’s have a look back at the hottest commodity topics of 2014:

Top Ten Reader’s Choice:

1. BACKWARDATION IS BACK! 2013 is the first year commodities have been in backwardation since 2003.  For those of you who need a refresher on the definition of backwardation, you are not alone, so here it is: “When a near-month futures contract is trading at a premium to more distant contracts, we say that a commodity futures curve is in “backwardation” or that the commodity is “backwardated.” This occurs when inventories of commodities are tight so market participants are willing to pay a premium to buy the immediate Read more […] – See more at: https://www.indexologyblog.com/?s=backwardation+is+back#sthash.BIUqx2dG.dpuf

2. COMMODITY COMEBACK It is no surprise that now might be the perfect environment for brewing commodities. The S&P GSCI was up 4.5% in February and was in backwardation for the first time in February since 2004. In 2004, the S&P GSCI returned 17.3%. 22 of 24 commodities in the S&P GSCI were positive in February. All 5 sectors were positive, led by agriculture, up 9.7%, which had its best February since 2008. Coffee had its best month in 20 years and its second best month in history going Read more […] – See more at: https://www.indexologyblog.com/?s=commodity+comeback#sthash.72R7wcht.dpuf

3. Global Inflation Beta It is a familiar concept that commodities have provided inflation protection as discussed in a recent post about a discussion I had with Bluford Putnam, Managing Director and Chief Economist, of our partner, CME Group, to discuss why inflation is likely to appear this year. I have also discussed how much inflation protection has been provided in a special video on commodities and inflation from our Index Matters Series with Bob Greer of PIMCO and Boris Shrayer (formerly) from Morgan Stanley. Inflation Read more […] – See more at: https://www.indexologyblog.com/?s=global+inflation+beta#sthash.IrsgIiLu.dpuf

4. How Smart Is Dr. Copper? Copper is reputed to have earned a Ph.D. in economics because of its ability to predict turning points in the global economy.  This is since copper is so broadly used across industries from building construction, machinery, power generation and transmission, electronic product manufacturing and in transportation vehicles. As the demand for copper rises, its price likely increases and suggests a growing global economy. Conversely, declining copper prices may indicate sluggish demand and an imminent Read more […] – See more at: https://www.indexologyblog.com/?s=dr.+copper#sthash.Bl9rKT6f.dpuf

5. Dow Jones Commodity Index Wins Independence There could be no more symbolic time than just before the July 4th holiday for S&P Dow Jones Indices (S&P DJI) to announce the Dow Jones Commodity Index (DJCI), an alternative to the former DJ-UBS. This is the first ever commodity index under the Dow Jones brand to be fully free from conflicts of interest, plus it highlights diversification and liquidity as its intrinsic characteristics. Please see the table below summarizing the key differences between the DJCI and former DJ-UBS: What Read more […] – See more at: https://www.indexologyblog.com/?s=wins+independence#sthash.GRuVkVZw.dpuf

6. Natural Gas Is Backwardated And The Weather Is Backwards When I see a forecast of freezing weather, unlike most, I don’t think about how I will dress warmly or prepare for the cold.  As a commodity lady, I think about how much the price of natural gas will increase. However when I saw this on TV yesterday, I had more food for thought than just the price of natural gas.  Notice Friday’s high is listed as 18 degrees Fahrenheit (about -8 Celsius) while the low is listed as 19 degrees Fahrenheit (about -7 Celsius). I only chuckled for a moment before Read more […] – See more at: https://www.indexologyblog.com/?s=natural+gas+is+backward#sthash.ZTlHz9AT.dpuf

7. Brent Ousts WTI From Top Spot The S&P GSCI 2015 Rebalance Preview marks a historic shift in the benchmark renowned for its world production weight.  According to this announcement of pro-forma weights, Brent crude oil is targeted take over WTI’s status as the leading oil benchmark and the most heavily weighted commodity in the S&P GSCI. This is the first time since 1997 that a commodity other than WTI crude oil is set to be the most heavily weighted. (Natural gas was greater at times from 1994-7.) In 1987, Read more […] – See more at: https://www.indexologyblog.com/?s=brent+ousts#sthash.KZTLQWUT.dpuf

8. What Is So Super About Chinese Demand? We have heard for many years now about the Chinese super-cycle that supported commodity prices since 1999 and we have also heard many debates about whether it has ended.  So if it has ended what now? How huge is the impact on commodity prices? That all depends on the level of inventories that result from the combination of supply and demand. Theoretically if there were no inventories or supply, it wouldn’t matter how much Chinese demand fell. They could demand all they wanted but there would Read more […] – See more at: https://www.indexologyblog.com/?s=what+is+so+super#sthash.3FOiyvTf.dpuf

9. WARNING: Hot Coffee May Burn There are too many funny coffee jokes to single one out but this one I found seriously relevant: Though I take my coffee black, I also take it seriously since it is one of the commodities in the S&P GSCI and DJ-UBS. Coffee has been the best performing commodity this year, up 23.9%.  As I mentioned in a prior post,  Coffee is up since the consumption of coffee in China is expected to grow by an annual rate of 9% for the next five years. This is not only from China’s large population Read more […] – See more at: https://www.indexologyblog.com/?s=warning#sthash.09jSV3Ax.dpuf

10. Don’t Put All Your Eggs In One Basket It’s a little late for an Easter post but this saying is about one of the key investment principles, diversification.  Simply put, diversification happens when assets inside your portfolio move in opposite directions. The investment measure of diversification is correlation and it can range from -1.0 to +1.0. If correlation is -1.0 between two assets, then they have moved exactly opposite each other; conversely, if the correlation is +1.0, then they move exactly together.  Correlation of -1.0 is Read more […] – See more at: https://www.indexologyblog.com/?s=don%27t+put+all#sthash.MSAgzzAI.dpuf

Top Post From Seeking Alpha: The Scary Thing About Falling Oil Prices I don’t believe what the gas experts say, “that there is nowhere for gas prices to go but down.” After another bloodshed month for crude oil as evidenced by the S&P GSCI Crude Oil return of -10.9% in Oct, bringing it down 24.6% off its high on June 20, one might get excited about further savings at the pump. Save that excitement. The gas retailers are not looking to save any money for anyone but themselves. At least this is the story using data going back to 1991 from the EIA (U.S. Energy Read more […] – See more at: https://www.indexologyblog.com/?s=the+scary+thing#sthash.Kf5lMsTQ.dpuf

Top Post From LinkedIn: The Disparity Of Risk Parity The simple concept of risk parity is that within a portfolio, each investment contributes equally to the overall portfolio risk.  For example, a portfolio with a capital allocation of 50% equities and 50% t-bills, has a risk profile where over 99% of risk comes from the equities.  In a risk parity portfolio, if 50% risk (contribution to variance) were allocated each to equities and t-bills, the capital allocation looks more like 5% in equities and 95% in t-bills. As Blackrock published in a Read more […] – See more at: https://www.indexologyblog.com/?s=disparity+of+risk#sthash.80AqUmVW.dpuf

Top Media Pickup: Is Climate Change Impacting Your Grocery Bill? It doesn’t take a weatherman to point out the crazy weather we have experienced in the recent past. There are more severe droughts, storms, freezes and heat that many blame on climate change. The National Climate Assessment, that will drive Barack Obama’s environmental agenda, notes that average temperature in the US has increased by about 1.5F (0.8C) since 1895, with more than 80% of that rise since 1980. The last decade was the hottest on record in the US. What impact does this spike Read more […] – See more at: https://www.indexologyblog.com/?s=climate+change#sthash.HgFHRYhh.dpuf

Contributor’s Choice: Picking Factors Beats Picking Winners If you were to ask a few commodity experts what is going on with precious metals (like an attendee did at our 8th annual commodities conference), the answer is long-winded since the story is different for each commodity.  A few years back, the answer was far more simple where it depended on the RORO environment that overpowered supply and demand models of individual commodities and spiked correlations. The quantitative easing caused all the commodities to move together, and the excess inventories Read more […] – See more at: https://www.indexologyblog.com/?s=picking+factors#sthash.OdgWbuMR.dpuf


The posts on this blog are opinions, not advice. Please read our Disclaimers.

The Petroleum Puzzle

Contributor Image
David Blitzer

Former Managing Director and Chairman of the Index Committee

S&P Dow Jones Indices

With oil prices down 50% from last June and holding steady consumers are looking forward to cheaper gasoline and lower heating bills and investors are rethinking where to put their money; it is a good time to take stock of what might happen next.

As discussed on this blog in late November, both lower demand and larger supply deserve credit (or blame) for the price drop. Weaker economies in Europe and Japan and lower economic growth in China are all reducing global oil demand.  Supply is being boosted by increased production in the US and from unanticipated production in Libya and Iraq.  However, falling oil prices may set in motion forces that could reverse all this as cheaper oil leads to stronger economies and forces some marginal producers out of business. Based on some recent reports, following is a look at how things stand now.

  1. Because oil demand is inelastic, small changes in consumption generate large changes in price. Estimates from the International Energy Agency  cited by the IMF show that oil demand forecasts are down about one percent since last Spring.  That short fall represents about one million barrels per day (mmb/d) given that global consumption is currently 90 to 92 mmb/d.  This probably accounts for about $12 to $15 of the roughly $55 dollar drop in prices.
  2. Figures from the US Energy Information Agency  show world production up about 2 million b/d from 2013 to 2014. OPEC production was down slightly so US, Libya, Iraq and others more than made up the difference.
  3. Saudi Arabia, and OPEC, decided not to cut production in an effort to raise prices. The days when OPEC could cut production and raise prices almost at will are gone, at least for now. The strategy has changed from raising prices to holding market share. Were Saudi Arabia to cut production enough to raise prices, the benefit of higher prices would be enjoyed by other producers – not Saudi Arabia. Far better to keep producers united and wait for today’s low prices to force high cost producers (US shale) out of the market.
  4. The IMF cites a global supply curve for oil published by Rystad Energy Research. If one assumes world consumption of about 90-92 mmb/d, the market equilibrium price would be around $70-$75/barrel.  At $70-$75, some US production would probably be lost and employment and investment in oil exploration might decline slightly.
  5. This figure isn’t far off the futures price for Brent crude looking out a year to 18 months. The chart shows futures prices for Brent, the global benchmark for petroleum, monthly over the next year and then at 18, 24, 36 and 48 months into the future.

Does this mean we can expect $75 oil for a while? Probably not.  The forces put in motion by the drop from $110 to $55 are still shifting and shaping oil production and world demand. Today’s cheaper oil may sow the seeds of future price rises. The most one can say is that oil prices will rebound somewhat, sometime – by how much and when can’t be determined for sure.

The posts on this blog are opinions, not advice. Please read our Disclaimers.

How Hell Freezes Over

Contributor Image
Tim Edwards

Managing Director, Index Investment Strategy

S&P Dow Jones Indices

Between Christmas and New Year, the familiar roar of events turns staccato and the market is gently buffeted by meager trading volumes; the relentless pursuit of profit that agitates the flight of global capital is sedated.  The books are largely closed; the offices of major financial institutions are staffed by fragile acolytes bereft of their titans.  Decisions, if any, are postponed.

Considered contemplation (a luxury denied in more urgent times) is apt.  What more appropriate position of comfort to consider the very nature of crisis?

Crisis, by our understanding of it, should be extraordinary, yet it seems crises are presented to the capital markets ordinarily.  Why (and how) this happens is a deep question, involving not just market structure and probabilities but also human psychology.  A simpler question is to ask what how we might comprehend the alarming frequency with which large movements occur in the equity markets: daily swings of over 10% in benchmarks like the S&P 500 are seven times larger than the average variation – theoretically they should be expected only once in billions of years.1  How then, can they occur so frequently?

The dynamics of volatility are the focus of our latest whitepaper, which explains how dispersion and correlation interact to create crises. One of the interesting features we examined was, in particular, how market volatility reacts to high correlations, and what happens if dispersion moves subsequently. The concepts are fairly simply expressed, and the viewpoint can provide a useful insight into the nature of crisis.

Correlations drive market risk

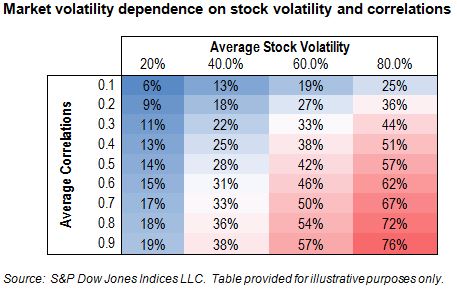
“The market” is made up of a large number of stocks. Each has its own volatility (which may vary) and each stock correlates to some degree (which may vary) with every other stock in the market. All else being equal, market volatility will be higher if the volatility of the average stock rises and if the average stock-to-stock correlation rises.  The precise relationship can be derived analytically; the table below illustrates the range of market volatility that can result from a reasonable (and historically realistic) range of input variables.

Hell 1

A very wide range of market volatilities is possible and, viewed from this perspective, the importance of correlations is starkly apparent.  In fact, comparing the top left of the table to the bottom right, it seems quite feasible that from one environment to another market volatility might increase by a multiple of over twelve times.  An event that a risk manager might previously dismiss as impossible “because it is twelve standard deviations away from the mean” can suddenly become simply “standard.”

At high correlations, molehills become mountains.

Correlations also help to explain the “flashes” of volatility that occur from time to time.  Stocks themselves encode the risk of the market they inhabit as well as whichever specific day-to-day or structural risks are particular to their business.  The idiosyncratic, non-market risk of each individual stock is clearly particular to that stock.  However, the aggregate level of all such risks among all the stocks in the market is no doubt of interest to risk managers, and in fact it is arguably an important characteristic of the market environment.

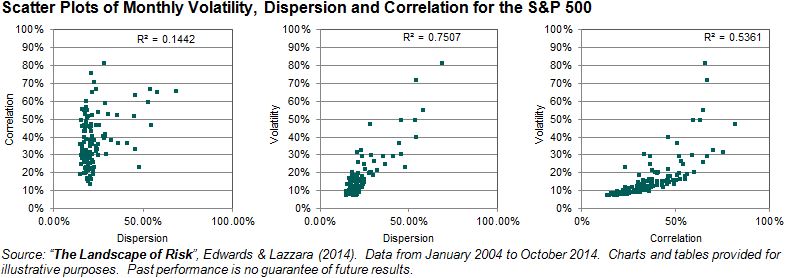
The idiosyncratic risks of every stock aggregate to a measure known as dispersion.  Intuitively, one would expect dispersion move in the opposite direction to correlations over time, whereas (as per the table above) one expects market volatility to go up and down together with correlation.  Here is a historical snapshot of each for an extended period in the S&P 500:

Hell 2

The fascinating, and important, observation to make from the scatter plots is that correlation and dispersion have been remarkably independent.  This has a deeply important consequence.  Other things equal, an increase of either correlation or dispersion will increase volatility.  But at high correlation levels, any subsequent increase in dispersion will generally convert at an elevated multiple into market volatility.  Since dispersion and correlations are somewhat independent, it is quite possible that, even during periods of high correlation, there will be small changes in dispersion – which entail far more dramatic effects in market volatility.  And perhaps this explains why, as the “flash crashes” that followed the financial crisis demonstrated, in periods of high correlation, idiosyncratic events can have systemic consequences.


  1. Calculating such probabilities requires assumptions on how prices move – the most famous of which that price changes roughly follow a Normal (or “Gaussian”) distribution. This distribution is famous for good reason. It turns up all over the place; in fact the theory says that it should turn up most places, eventually. Beginning with Bachelier’s PhD thesis in 1900, through the Black-Scholes’s Nobel-prize winning options formula of 1973 and beyond to the present day, the normal distribution is inextricably linked with the mathematics of finance. Well, more fool us. “Incredibly unlikely” events happen all the time, it’s just that people can have short memories.


The posts on this blog are opinions, not advice. Please read our Disclaimers.

Impact of the Affordable Healthcare Act on Healthcare Cost Trends

Contributor Image
Michael Taggart

Consultant, S&P Healthcare Indices

S&P Dow Jones Indices

With the start of the second annual enrollment under the Affordable Care Act (ACA), there is high interest regarding the impact of the ACA on healthcare cost trends. The S&P Healthcare Claims Indices provide an accurate and up to date source of information available in the market regarding healthcare cost trends. The updates released in October 2014 are a measure for evaluating the impact of the ACA rules on healthcare trends.

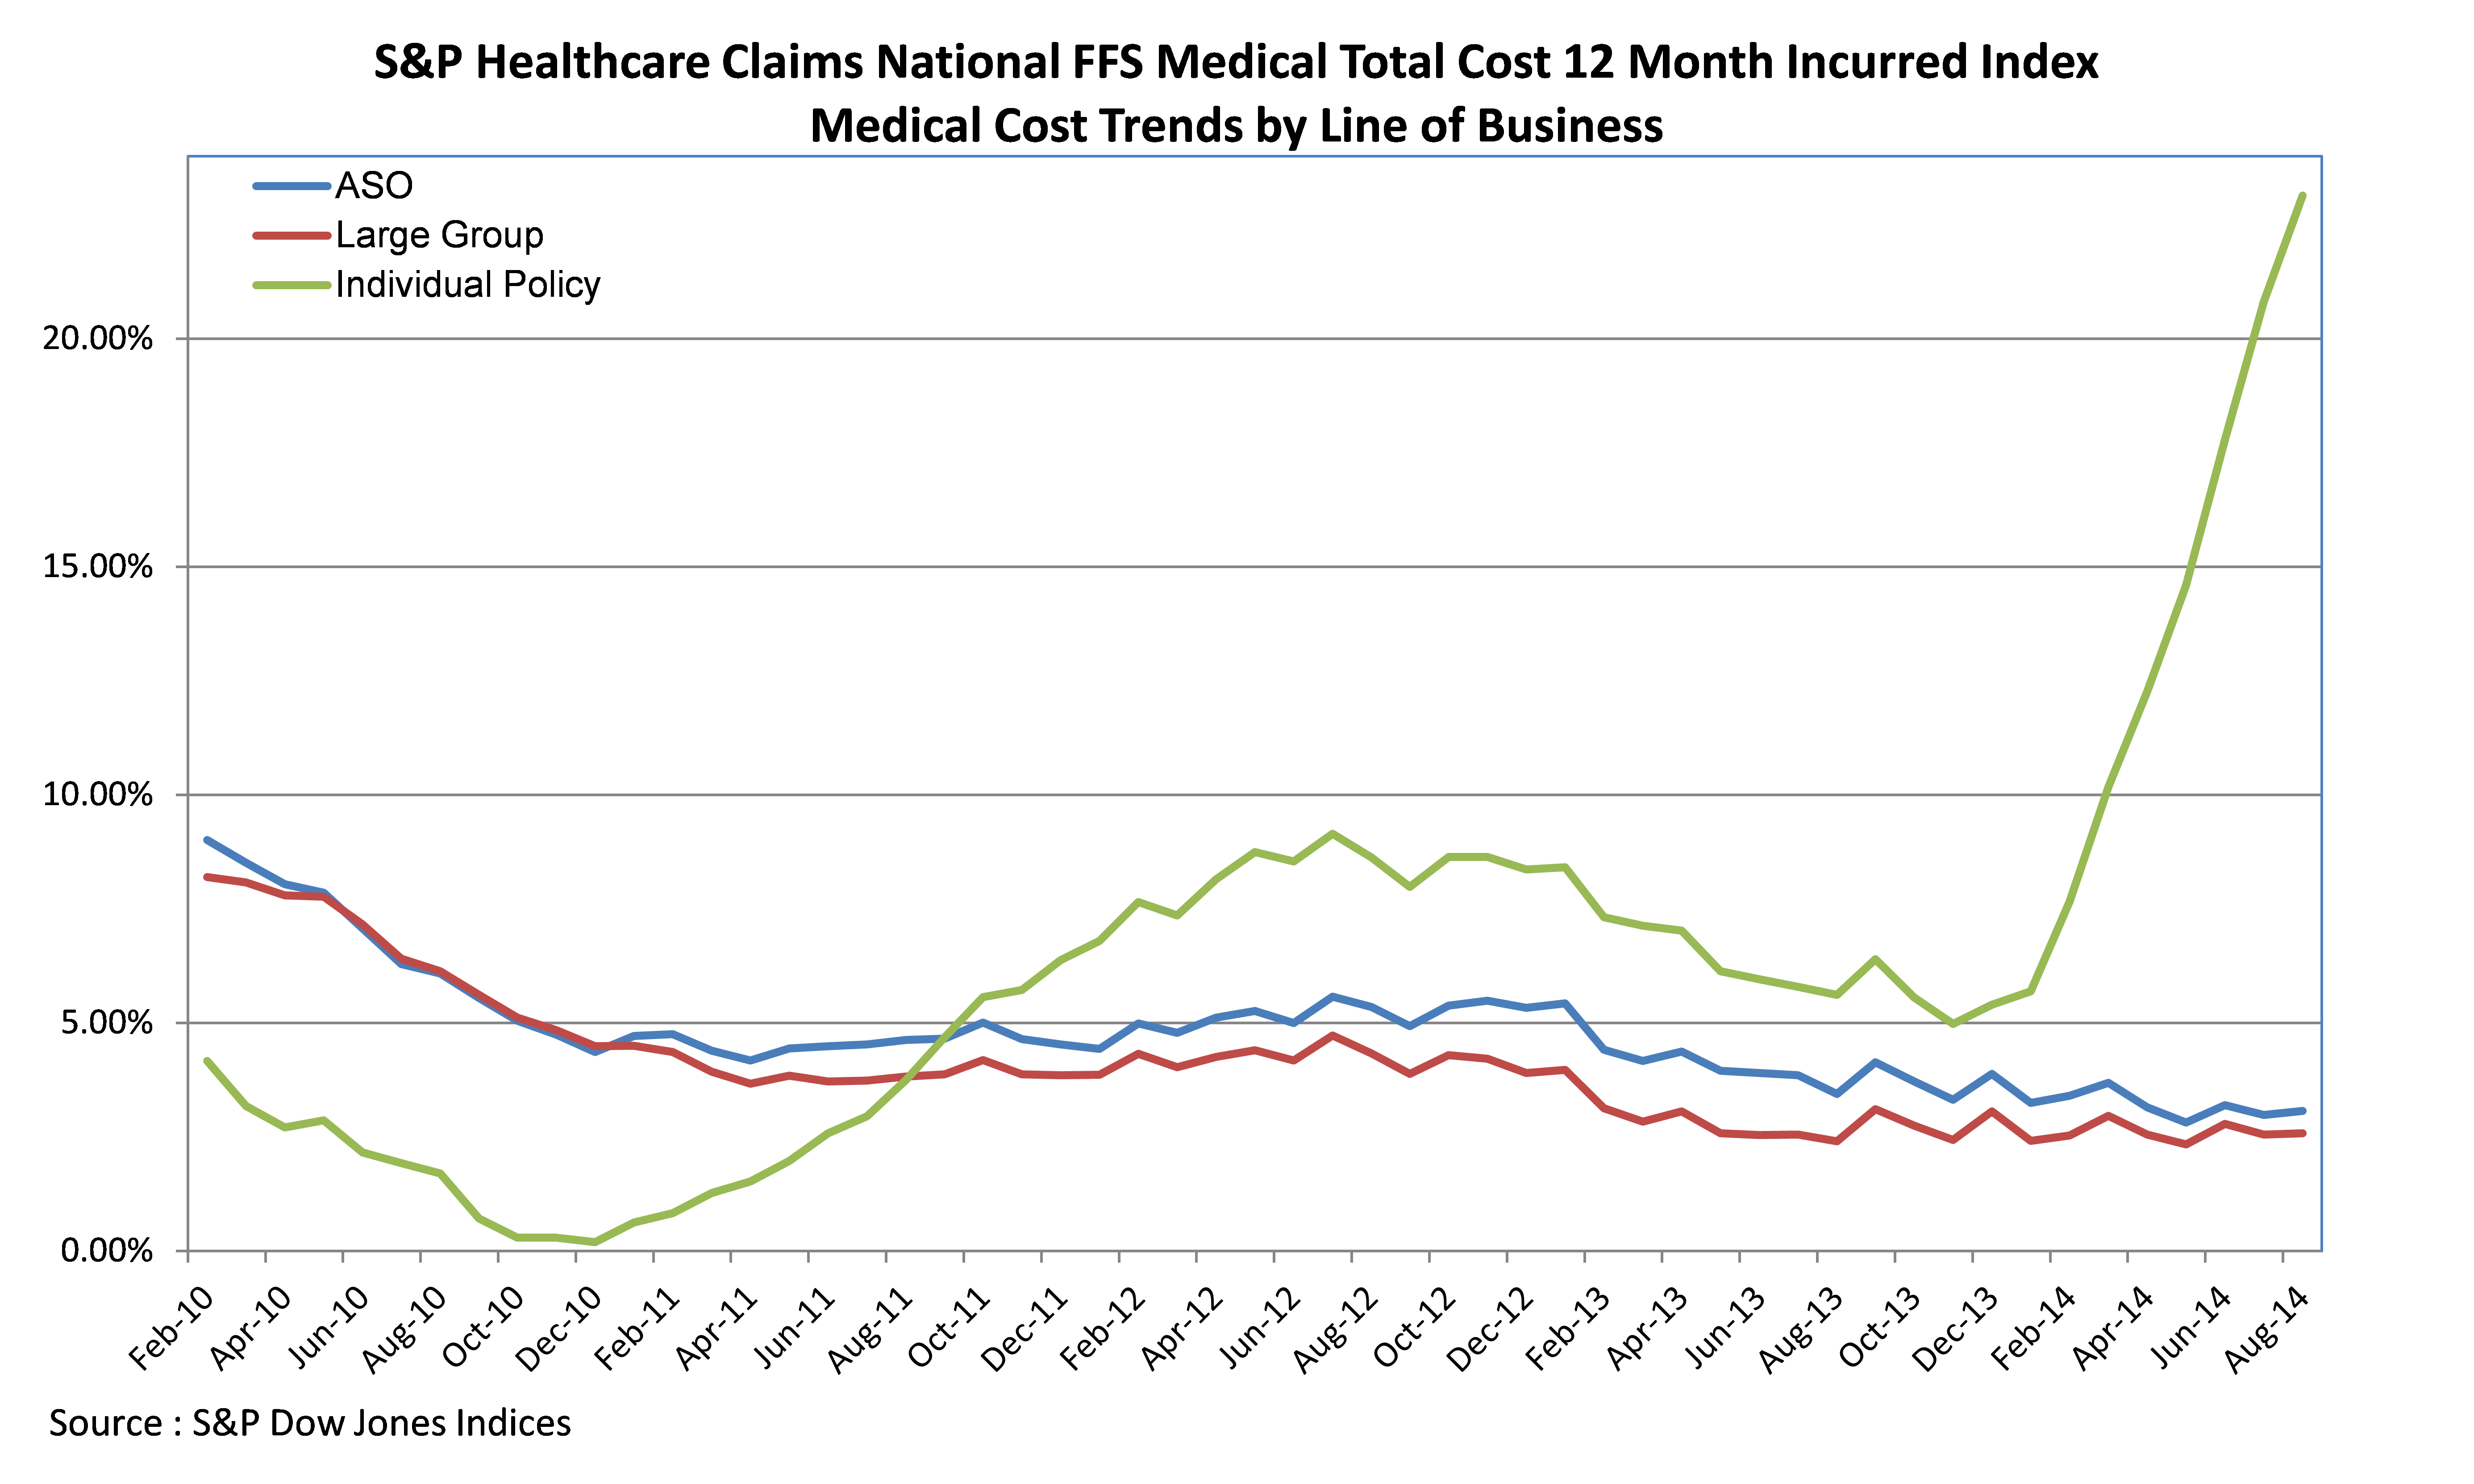
The graph below shows the actual 12-month year/year healthcare cost trends for commercial medical insurance plans, with trends shown separately for:

  • ASO (Self Funded) Plans – these plans are typically offered by large employers
  • Insured Group Plans – insurance plans provided by employers with more than 50 employees
  • Individual Plans – medical plans purchased by individuals (including the ACA exchanges)

taggart

A quick glance at the indices makes a couple of issues clear:

  • For most employer-based medical plans, trends reached a low of 3% during late 2011 and have since increased between 4% – 6% annually.
  • For individual plans, healthcare costs began trending upward in early 2011 (while employer costs were trending downward) rising to an annual increase between 6% – 8% by early 2012.
  • With the implementation of the ACA rules eliminating pre-existing conditions, individual medical trends are increasing significantly. The most recent indexes show medical trends at 18% annually and the graph makes clear that the trend may go higher before the market stabilizes.

The S&P Indices highlight a couple of critical realities regarding healthcare costs. First, there is no single “trend rate” of healthcare costs – there are multiple factors impacting healthcare costs and good analysis should provide an understanding of how specific populations and types of healthcare services are changing. Second, healthcare costs can be significantly impacted by public policy changes and it may take years for these changes to be fully evident. In the meantime, having accurate and up to date information about healthcare cost changes will be critical to managing healthcare programs.

The posts on this blog are opinions, not advice. Please read our Disclaimers.

Russian Ruble Rebounds (somewhat)

Contributor Image
David Blitzer

Former Managing Director and Chairman of the Index Committee

S&P Dow Jones Indices

To paraphrase Mark Twain upon reading his own obituary, “Reports of the ruble’s demise have been exaggerated.”   A week ago as the ruble skidded 17% down and briefly traded at almost 80 to the US dollar, commentators were ready to add the ruble to a long list of currencies that cratered in crises. As seen in the chart, the ruble has staged a recovery and now trading at about 55 to the dollar, where it was at the beginning of December.  Oil, the supposed cause of the ruble’s weakness hasn’t staged a similar rebound.

The rebound owes its success to a combination of traditional and novel policy moves and unexpected forbearance by investors.  The initial response from the Russian central bank was to jack up interest rates by 6.5 percentage points to 17%.  This woke everyone up, but didn’t slow the ruble’s slide.  The bank’s second move was to buy rubles in the forex markets – an effort which was successful in stemming the collapse for the moment.  Usually investors greet a currency crisis by pulling their money out as quickly as possible. However,  shares outstanding in one of the largest western ETFs investing in Russian stocks didn’t drop as investors held their ground. One factor encouraging hope for the ruble is the substantial foreign currency reserve position, cited as $400 billion, held by Moscow.

Some novel steps were taken in the last few days. A currency swap agreement between the Peoples Bank of China and the Russian central bank was re-confirmed. This assures additional foreign currency available to support the ruble if needed.  However, further efforts to hold or boost the ruble will probably require more buying of rubles in the forex markets. Recognizing this, the Russian government is telling some state supported corporations to sell their own foreign exchange reserves over the next few months. (link here) Additional efforts urging private sector companies in Russia to sell reserves and buy rubles are expected as well.  The Russian central bank also rescued a local Russian bank facing severe financial difficulties in a move that suggested more confidence on the part of Russian authorities than some expected. Amusingly, the bank is question uses the American movie actor Bruce Willis in its local (Russian) advertising.

The ruble’s rebound and current stability is certainly welcome news to Russia and the Russian government.  However, as Putin indicated in a recent speech, Russia faces a deep recession over the next year or two. Without a rebound in oil prices, it is likely to experience a large fiscal deficit and further economic challenges.  This will mean more pressure on the ruble.  The currency crisis is contained for the time being, but the risk of a deeper economic crisis remains.

The posts on this blog are opinions, not advice. Please read our Disclaimers.