


Copper is reputed to have earned a Ph.D. in economics because of its ability to predict turning points in the global economy. This is since copper is so broadly used across industries from building construction, machinery, power generation and transmission, electronic product manufacturing and in transportation vehicles. As the demand for copper rises, its price likely increases and suggests a growing global economy. Conversely, declining copper prices may indicate sluggish demand and an imminent economic slowdown.
Given the recent drop in the S&P GSCI Copper, down 3.7% on Friday March 7, bringing the YTD loss to 7.5%, might that be an indicator of China’s slowing economy? It has been shown that (lagged) copper has a correlation of roughly 0.4 with world GDP growth, which can be considered moderate at best. Further, while copper returns appear highest in the strong expansion phase and lowest in the strong recession phase, what is interesting is that returns seem to hold up quite well during periods of weak recession. Please see the chart below from my colleague, Daniel Ung, published in this paper on the S&P GSCI Cash Copper.

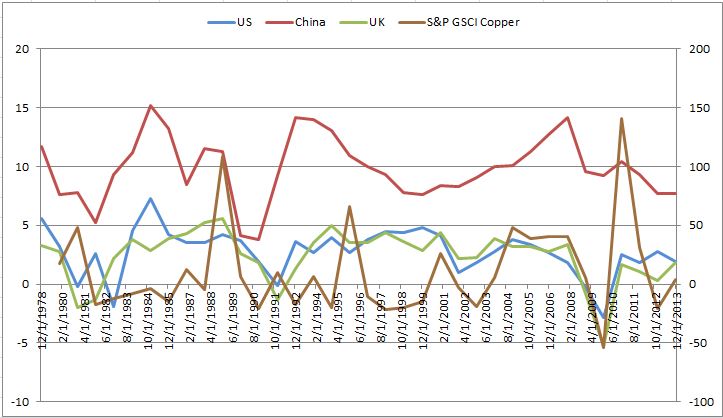
Further, below is a chart of yoy% GDP growth from the U.S., China and the U.K. with the S&P GSCI Copper lagged one year, which again shows some relationship but not a super compelling case that copper should earn a Ph.D. from predicting turning points in the economic cycle.
Unfortunately, the idea that the of the economy can be predicted by the demand reflected in the price of copper, is not the full picture of health. The supply side of the price equation is just as important and economic theory dictates that demand strength does not automatically translate into price hikes. Instead, it is the lack of an adequate supply response coupled with a rise in demand for supply-inelastic products, such as copper, that results in price inflation. It follows from this, that in many ways, supply is arguably more important than demand in explaining the recent behavior of the copper market.
This assertion is borne out by statistics. Over the last decade, according to World Bureau of Metal Statistics (2012), primary mine production grew by a meager 1.8% per year compared to demand, which rose by 2.4%. The copper market was in supply deficit for seven years in the last decade.
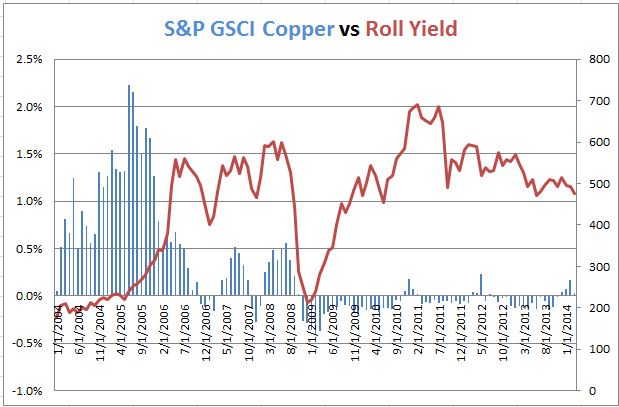
Below is a chart of the S&P GSCI Copper versus the roll yield, which is a measure of the term structure indicating a shortage or backwardation with a positive return and an excess or contango with a negative return. Why it is more interesting than the chart above that shows copper versus GDP, is that it shows the the relationship of copper to its inventory situation. Copper was one of the few commodities with strong shortages prior to the financial crisis, but eventually the demand decline was too strong for the shortage to have an impact. Eventually the inventories caught up to and surpassed the demand as suppliers had rushed to bring more copper to the market. By the time the worst of the crisis passed, there was significant contango or excess inventory despite the rise in copper price.
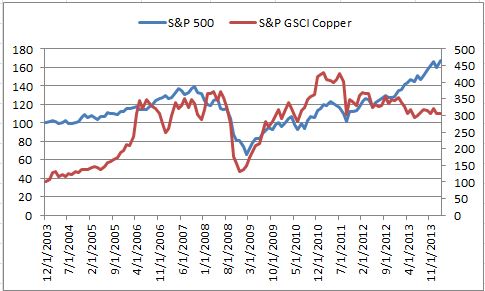
However, unlike stocks that recovered well after their dip in 2011, copper can’t seem to comeback.
This might change though despite the reports of worries about the Chinese economy in light of the first default on a bond from a company traded in mainland China, and also after the official manufacturing PMI in Feb fell to an eight-month low of 50.2, just above the 50 level that separates contraction from expansion.
China accounts for 40% of global copper consumption, and even a small drop in demand could leave the market awash in extra metal. However, given there has been a shortage (as shown by the roll yield) for 4 months straight now, it is possible copper could rebound.
As I have mentioned in prior notes, there are great opportunities for individual commodities now from the shortages that create low correlations across the spectrum. It may or may not be time for copper but what is certain is that its supply shocks differ from the current shocks of agriculture and energy.
The posts on this blog are opinions, not advice. Please read our Disclaimers.


