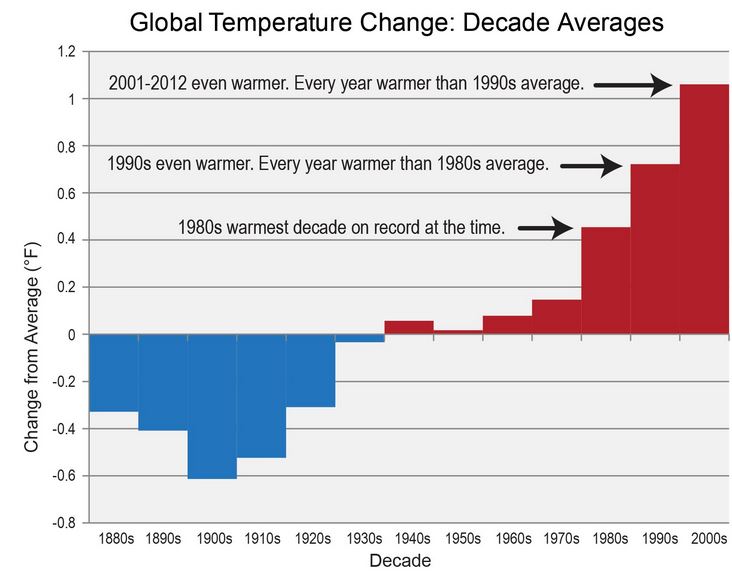
It doesn’t take a weatherman to point out the crazy weather we have experienced in the recent past. There are more severe droughts, storms, freezes and heat that many blame on climate change. The National Climate Assessment, that will drive Barack Obama’s environmental agenda, notes that average temperature in the US has increased by about 1.5F (0.8C) since 1895, with more than 80% of that rise since 1980. The last decade was the hottest on record in the US.
What impact does this spike in temperature have on agriculture and the price of food we consume?
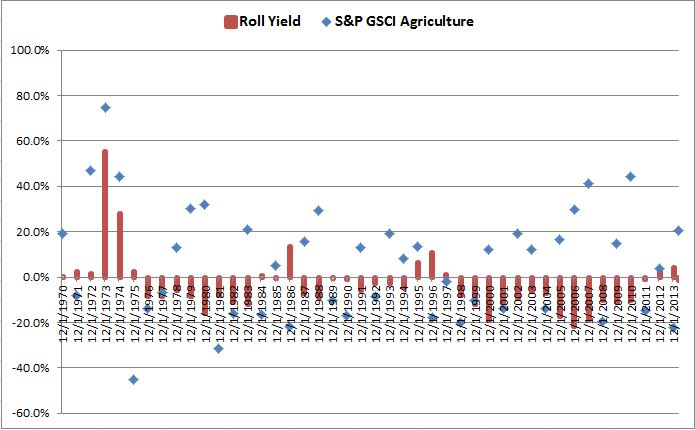
It depends on a number of factors and the answer may be different than you think. Production, a factor some think is an obvious driver, is often not closely related to price, which can be observed somewhat through the relationship of roll yield and price returns. Although in 1973, when a large percentage shortfall from expected production occurred, there was a large price spike, sometimes the impact has been far less severe. Other shortfalls happened in 1983, 1988, 1993 and in 2012 but the prices barely moved. The chart shows that a significant production shortfall is neither necessary nor sufficient to cause a price spike.
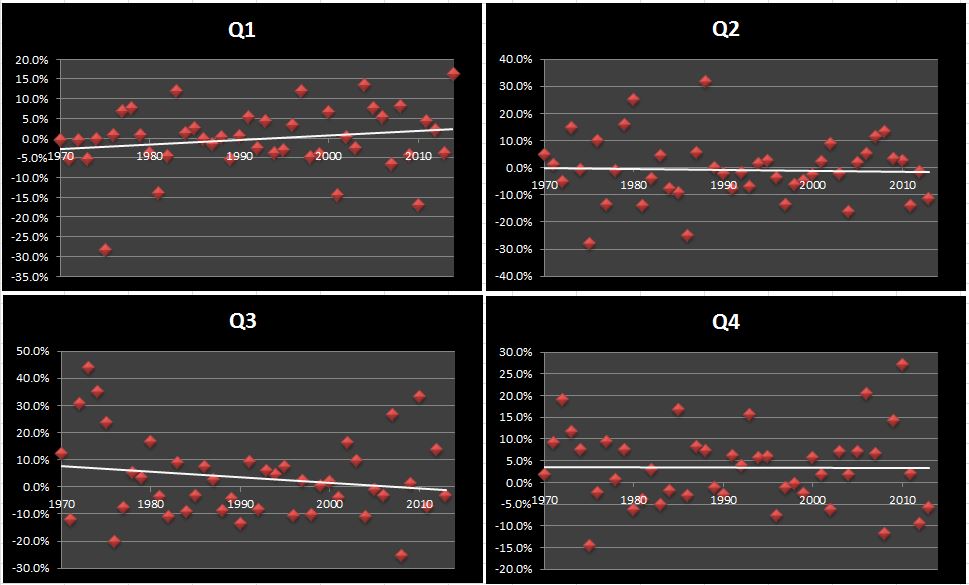
Looking at seasonal data that is broken by quarter from 1970-2014, the S&P GSCI Agriculture returns are generally stable with a decrease in returns during the summer quarters (Q3) mainly from the huge spike in the mid 70’s.
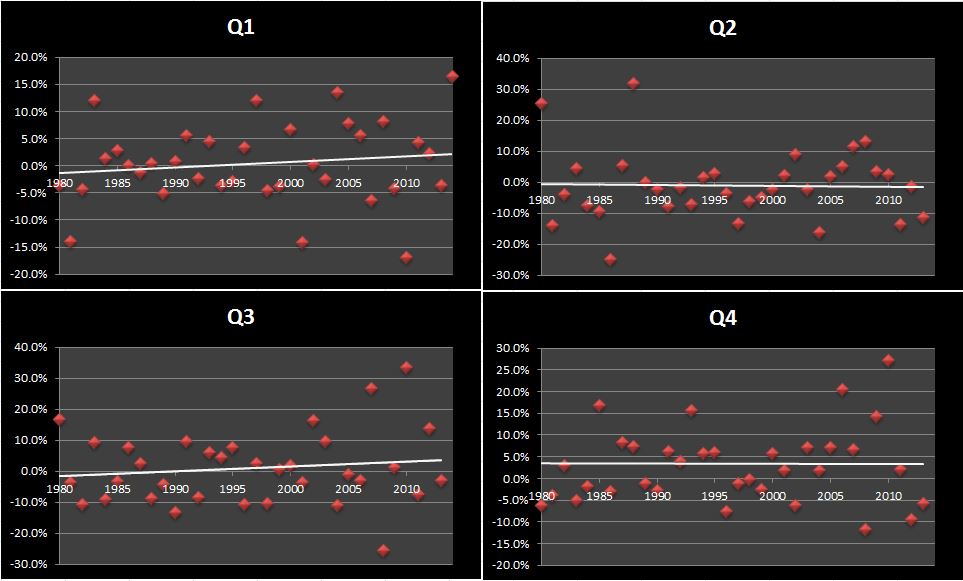
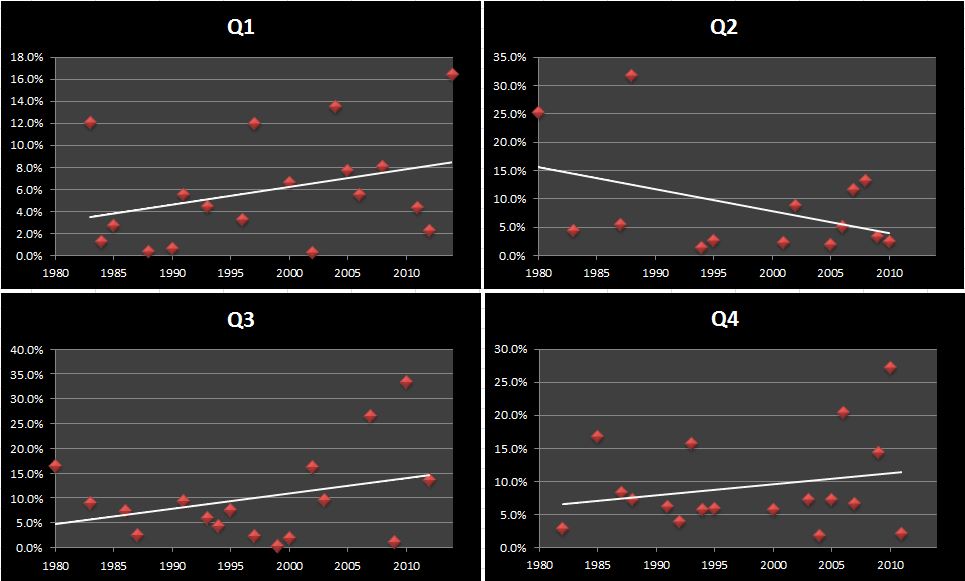
However, more than 80% of the temperature rise has occurred since 1980, and with that has come some prices increases, even with the financial crisis and huge demand drop of 2008-9. When we cut the shortfall of the 70’s out, the picture changes with an increase of roughly 16 basis points per summer quarter (Q3), which could be due to the climate change.
What is more interesting is the rise in premiums when premiums were commanded. Notice Q1 of 2014 is the best performing first quarter in the history of the index. Seasonally in Q3, when the dog days of summer occur, is when the prices spike most. Q3 of 2010 was the best performing summer in history, up 33.4%, besides in 1973 when prices spiked 44.0%. Return premiums are rising through time, except in the second quarter, and on average have been 6.0% (Q1), 8.6% (Q2), 10.0% (Q3) and 9.2% (Q4) with average quarterly rises of 0.16% (Q1), -0.39% (Q2), 0.30% (Q3) and 0.17% (Q4) .
Then can rising prices be attributed to hotter summers?
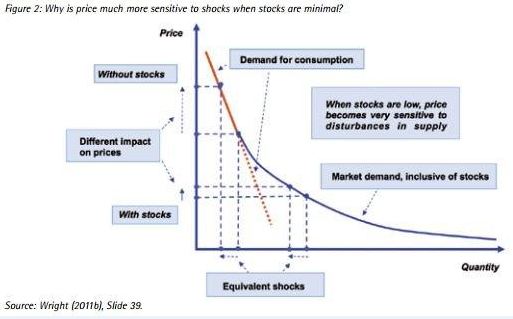
There are still more factors at play such as inventories that incorporate supply, demand and storage. Remember when inventories are critically low, like they were in the 70’s and may be now, prices are much more sensitive to shocks like weather. According to Agricultural Market Information System (AMIS), “The discussion of the commodity market model shows that stocks moderate the price-increasing effects of negative shocks to available supply. Price spikes occur after stocks have been depleted. These observations have two implications: a. Price spikes tend to come after price has already increased to a threshold price region, consistent with low aggregate supply. b. Price spikes generally come only after stocks have been depleted to a low “critical” region.”
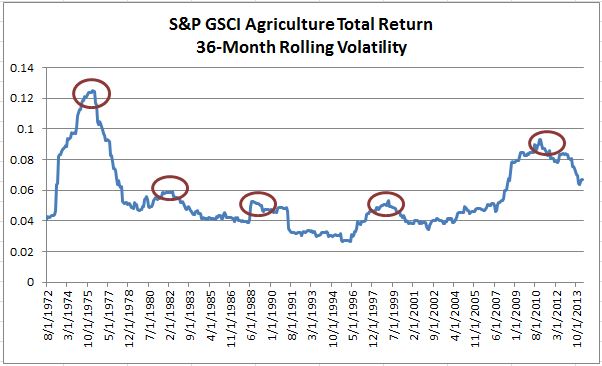
Also, the amount of risk investors are willing to take to supply the insurance to the producers may be lower depending on the time frame, such as after the financial crisis. When this happens, producers have less incentive to produce and store, causing volatility to spike as described by Lutz Killian. See the chart below for spikes in volatility that correlate to production shortfalls.
Still all of these factors taken together, do not necessarily mean you will be spending more at the grocery store, especially if the commercial consumer like a cereal maker uses a substitute. According to Hicks’ theory of congenital weakness, it is easier for consumers to choose alternatives so they are less vulnerable to price increases than producers are to price drops. This means you may be eating wheat rather than corn, or soybean oil rather than palm oil, so that the price you pay at the grocery store is not higher.
Population growth and wealth are also key factors in driving the prices of agriculture. In major consuming countries such as China and India, parts of the population consume both wheat and rice, and, as rice consumers become wealthier, they tend to substitute some wheat products for rice. (The countries are also stockpiling the grains, taking more supply off the market, possibly driving prices even higher.)
Whether the substitution is from the commercial consumer or by choice from the retail consumer, sometimes unfortunately substitution is not possible such as in 1975. The poor corn harvest in the United States occurred when global wheat and rice supplies were also low, so the usual substitutes could not fill the global yield gap in corn.
Various prices are reported by consumers in different regions, especially those far from developed futures exchanges. Also, sometimes consumer prices reflect other factors like taxes or trade bans. So, it is possible index levels recorded in the agriculture sector do not accurately represent the marginal value to global consumers. However, global prices as measured by indices are often by far the best available measures of the state of the world’s agriculture markets.
That said, the the prices you see at the grocery store may very well be increasing from global warming. Though you don’t need to be poorer by shopping for food and may offset this inflation with a basket of commodities.
The posts on this blog are opinions, not advice. Please read our Disclaimers.