Get Indexology® Blog updates via email.

In This List

Most-Read Blog Posts Q4 2015

Dow Jones Industrial Average - 2015 Year in Review

The Rieger Report: 500 Index Sectors - Final 2015 Results

2015’s Rising Tide of ETFs in India

The Commodity Catastrophe of 2015

Most-Read Blog Posts Q4 2015

Contributor Image
Paul Murdock

Manager, Content & Delivery

S&P Dow Jones Indices

In case you missed them, we’ve compiled the most read blogs from the fourth quarter below.

Losing My Religion: Value in the USA
How have value indices performed and will value investing “work” in the future?

The Rieger Report: Munis Lead the Pack in the Final Lap
How did the municipal bond market perform in 2015?

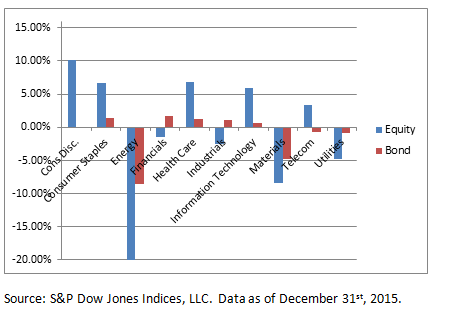
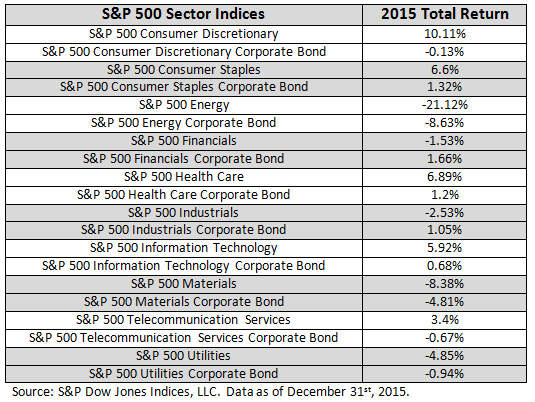
Energy Stocks and Bonds Say Oil May Have Bottomed
Has oil reached its bottom or is this just the market sentiment?

How Did European Active Managers Perform Over the Past 10 Years?
What were the results of the 2015 mid-year SPIVA® Europe Scorecard?

DJSI: A Journey Toward Sustainability and Beyond
How have the DJSI played a supporting role in leveraging sustainability as a key business driver for corporate success?

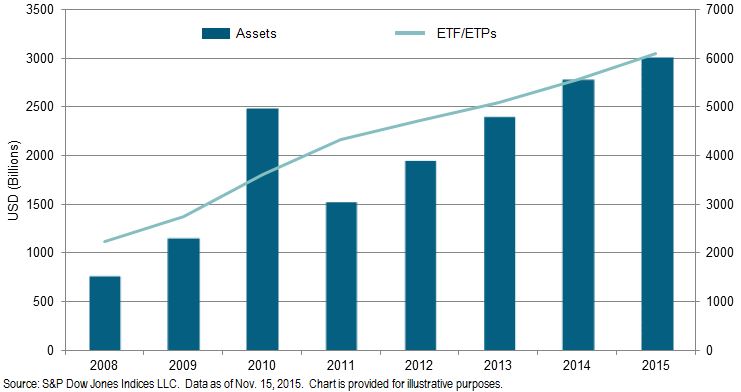
ETF Industry in India Over the Years
How has the ETF industry in India advanced over the years?

The posts on this blog are opinions, not advice. Please read our Disclaimers.

Dow Jones Industrial Average - 2015 Year in Review

Contributor Image
Jamie Farmer

Former Chief Commercial Officer

S&P Dow Jones Indices

The Dow Jones Industrial Average ended 2015 at 17,425.03 – down 398.04 points on the year for a -2.23% annual return.

  • Leader & Laggard – Nike (NKE) was the biggest contributor during 2015;
    Walmart (WMT) was the biggest detractor.
  • Industry Performance – Consumer Services was the leading industry for the
    year; technology the worst.
  • Worst Day (In Points & Percent) – down 588.40 points or -3.57% – on August
    24th. While bad – the worst 1 day loss since August 2011 – it could have been
    worse: the DJIA was down over 1,000 points in early trading before recovering.
  • Best Day (In Points & Percent) – a mere two days later, on August 26th, the DJIA
    finished up 619.07 points or 3.95% as investors were drawn back to the markets
    following a period of apparent panic selling.
  • New Highs – the second half of 2015 saw no new highs for the DJIA, the last
    having been struck on May 19, 2015 when the Average closed at 18,312.39.
  • Changes – there was a momentous component change when Apple replaced
    AT&T. Additionally, there were a few significant stock splits in 2015.

Capture

Download the full report

The posts on this blog are opinions, not advice. Please read our Disclaimers.

The Rieger Report: 500 Index Sectors - Final 2015 Results

Contributor Image
J.R. Rieger

Former Head of Fixed Income Indices

S&P Dow Jones Indices

The S&P 500 Bond Index sectors creates the opportunity to examine sector performance on both the stock and bonds issued by the companies in the S&P 500 Index.   The 2015 results: As expected corporate bonds were less volatile than their equity counterparts but they still suffered from the energy and materials onslaught.

Highlights (total returns used for comparability):

  • Of the ten sectors sampled, five equity sectors saw positive returns in 2015.
  • Bonds of the five sectors with negative performance did better than equities of those sectors.
  • Energy was the biggest mover with equities down over 21% and bonds of those same companies down over 8.6%.
  • Materials was also impacted hard in 2015 with equities down over 8.3% and bonds of those same companies down over 4.8%.

Chart 1: Selected S&P 500 sector indices for stocks and bonds

Blog Sectors 1 4 2015 Chart

Table 1: Selected S&P 500 sector indices for stocks and bonds

Blog Sectors 1 4 2015 Table

The posts on this blog are opinions, not advice. Please read our Disclaimers.

2015’s Rising Tide of ETFs in India

Contributor Image
Koel Ghosh

Former Head of South Asia

S&P Dow Jones Indices

In October 2015, the global ETF industry witnessed its all-time high of the year, with over 6,000 ETFs and ETPs and assets reaching the USD 3 trillion mark. The year also saw month-over-month increases in inflows to ETFs, with record increases in assets across regions.  Japan led in terms of year-to-date growth, with an increase of over 200%. However, in absolute terms, the leaders have been the usual: the U.S. and Europe. As per the latest numbers for the end of November, ETFs and ETPs have gathered over USD 300 billion in net new assets, which is a record in itself.

India has not been far behind in this year’s trend in ETFs. It indeed has been an interesting year for investors in India. Who would have imagined that India’s biggest pension fund would make a foray into equities, and using ETFs as the vehicle?  Was this a positive move? It definitely seems that way! The impetus provided to the segment was tremendous and the Indian ETF industry, which had assets merely trickling in and was struggling to stay afloat, suddenly surfaced into the limelight.

At the end of March, the Indian Ministry of Labour gave notice of a new investment regulation for the Employees’ Provident Fund Organization (EPFO), which allowed investments of up to 5% of incremental income in ETFs. There was added flexibility for exempt PF trusts for which equity investment limits would be higher, and they could invest anywhere between 5%-15% of their funds in equity and equity-related instruments.

It was indeed a historic moment, and for the first time in its 64-year history, the EPFO announced its first ETF investments, in the S&P BSE SENSEX ETF and the Nifty ETF, in August 2015. This move brought some much-needed confidence in ETFs, whose advantages can include diversification, transparency, liquidity, and cost effectiveness.

The Indian ETF industry currently has 52 products with approximately USD 2 billion in assets. It is interesting to note that in 2005, there were just six ETF products, with assets not even adding up to USD 1 billion.

Exhibit 1: Global Assets in ETFs or ETPs 

Exhibit 1 - ETF

If we observe the growth of ETFs in global markets, we would see that a growth trend started in 2008, in which the number of ETFs and ETPs nearly tripled, from just over 2,000 ETFs in 2008 to over 6000 ETF and ETPs in November 2015, with assets increasing from over USD 700 billion to nearly USD 3 trillion in the same time period. While the first trillion took over a decade, the subsequent increase in assets has only taken a couple more years, which suggests a rate of exponential growth.

India seems to be on the brink of that rise, and with the new changes, positive sentiments, and the boost being provided to ETFs; we might be looking at a similar trend for the Indian markets.

The posts on this blog are opinions, not advice. Please read our Disclaimers.

The Commodity Catastrophe of 2015

Contributor Image
Jodie Gunzberg

Former Managing Director, Head of U.S. Equities

S&P Dow Jones Indices

2015 will go down in history as one of the worst years ever for commodities. The S&P GSCI Total Return lost 32.9%, posting its 4th biggest annual loss in history since 1970, and the Dow Jones Commodity Index (DJCI) lost 25.3%. Below are some notable statistics about what happened inside the indices:

2015 ended the S&P GSCI’s first 3-year consecutive loss in its history, losing a total of 55.6% during this time. 2015’s loss of 32.9% followed a similar loss of 33.1% in 2014 and a small loss of 1.2% in 2013.

Source: S&P Dow Jones Indices.
  • On Dec. 22, 2015, the S&P GSCI Total Return recorded a new maximum drawdown of -80.5% from its peak on July 3, 2008. The index on Dec. 22, 2015 was the lowest in more than 16 years, since Mar. 24, 1999.
Source: S&P Dow Jones Indices.
  • 2015 ended the S&P GSCI’s biggest 2-year consecutive loss, down 55.1%, and is only the 4th ever back-to-back annual loss. Other consecutive losses happened in 1975-76 (-17.2%, -11.9%), 1997-98 (-14.1%, -35.8%) and 2013-14 (-1.2%, -33.1%).
  • 2015 tied 2008 for a record number of negative commodities with 22 of 24 down. 20 of the 22 lost more than 10%, 13 lost more than 20%, 8 lost more than 30% and 5 lost more than 40%.

Single SPGSCI Losers 2015

  • Brent Crude lost 45.7% in 2015, the most of any single commodity. Other big losers were (WTI) Crude Oil (-45.3%), Nickel (-42.6%), Heating Oil (-41.4%) and Gasoil (-40.2%).
  • Cocoa and Cotton were the only winners in 2015, gaining 9.6% and 3.0%, respectively. Cocoa is the only commodity to have been positive in each of the past 3 years, gaining a total return of 37.5%. Interestingly, cocoa was also up in 2008, gaining 27.0% that year. Further, cocoa has only ever been down three times together with the overall index in 1991, 1998 and 2011.
  • 2015 is only the second time all five commodity sectors lost in a year. (1998 was the first.) Not only did every sector lose, but they all posted double-digit losses. Agriculture (-16.9%), Energy (-41.5%), Industrial Metals (-24.5%), Livestock (-18.3%) and Precious Metals (-11.1%). Over the past three years, their losses have been significant with about 2/3 shaved off energy, 40% each in metals and agriculture, and 10% off of livestock.
  • The S&P GSCI term structure in 2015 was the worst since 2010 and the 12th worst in history. Brent Crude posted its 4th worst roll yield, losing an additional 10.4% from contango. Natural gas lost 20.1% and (WTI) Crude Oil lost 14.9% from contango that are both severe but compared to their own histories, not as bad as brent crude’s loss.
  • For the year, six commodities contributed positive roll yield to the total return: copper, feeder cattle, lean hogs, live cattle, soybeans and unleaded gasoline.
  • Equities (S&P 500) have now outperformed commodities (S&P GSCI) for eight consecutive years that is a new record. Following the last time equities outperformed commodities for near as long in 1980-86, seven consecutive years, commodities returned almost 300% through 1990 as measured by the S&P GSCI Total Return index.

One area of concern is that recent correlation between equities and commodities has spiked, more than quadrupling since July.

Source: S&P Dow Jones Indices.

Together with the VIX (fear gauge) spike, investors may feel there is too much risk on the table and pull out of risky assets. If this happens, diversification benefits can be ruined like in the financial crisis – just when diversification was needed most.

Despite these overwhelmingly negative statistics, there have been some improvements in commodities recently that may be the start of a turnaround. In Dec., 2015, almost half of the commodities (11/24) were positive and eight were in backwardation that included feeder cattle, copper, cocoa, corn, cotton, Kansas wheat, wheat and live cattle. Also, the equity risk premium in energy signaled a bottom in Oct., 2015, El Nino and interest rates may help commodities, and again, the cycle between equities and commodities may switch. All of these may be positive for commodities going forward.

However, OPEC supply continues to be a headwind, though at some point, the demand from investors and consumers will likely pull back enough to hinder non-OPEC suppliers that may stabilize the market. Slowing Chinese demand growth and the strong dollar also haven’t helped commodities but it doesn’t seem to have impacted commodities across the board since each commodity has behaved differently and China stockpiled many commodities at cheap prices to fill reserves. The policy combined with weather make the future for commodities difficult to predict.


The posts on this blog are opinions, not advice. Please read our Disclaimers.