Get Indexology® Blog updates via email.

In This List

Energy Stocks and Bonds Say Oil May Have Bottomed

Most-Read Blog Posts Q3 2015

Why the S&P 500 Utilities Sector Shined in Q3

El Niño Won't Keep This Commodity Hot

Dow Jones Industrial Average Q3 2015 Performance Report Card

Energy Stocks and Bonds Say Oil May Have Bottomed

Contributor Image
Jodie Gunzberg

Former Managing Director, Head of U.S. Equities

S&P Dow Jones Indices

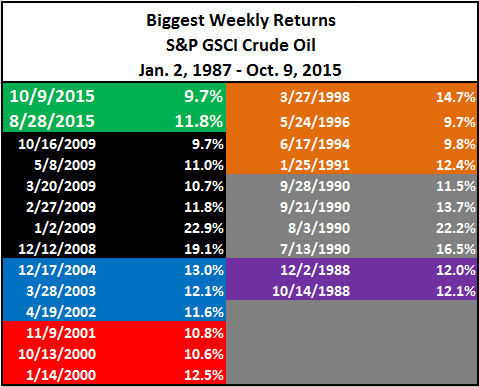
Last week, the S&P GSCI Crude Oil gained 9.7% in one of its best weeks (24/1501) in history since 1987. It was the second best week in 2015, following its gain of 11.8% in the last week of Aug. Historically, with the exception of the bottom in 1988, there have been greater than 2 weeks of spikes bigger than last week’s before a bottom was hit. So maybe oil hasn’t hit a bottom yet by this metric, but it wouldn’t be completely unprecedented or unreasonable.

Source: S&P Dow Jones Indice
Source: S&P Dow Jones Indices

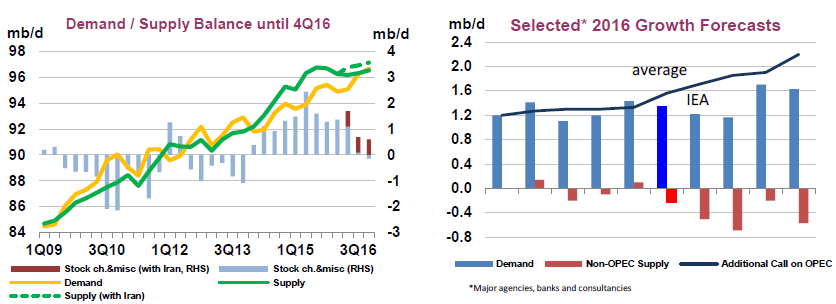
Although many supporting events happened simultaneously last week like a continued drop in US rig counts, concern about falling production in Canada and Bakken, the decision by the Fed to hold off on the interest rate hike and the Russian attacks on Syria, it’s difficult to make the case the rally is sustainable. Inventories are still very high and demand is questionable. According to the IEA’s Oil Market Report, “a projected marked slowdown in demand growth next year and the anticipated arrival of additional Iranian barrels – should international sanctions be eased – are likely to keep the market oversupplied through 2016.”

Sourec: International Energy Agency - Oil Market Report, Oct. 2015.
Source: International Energy Agency – Oil Market Report, Oct. 2015.

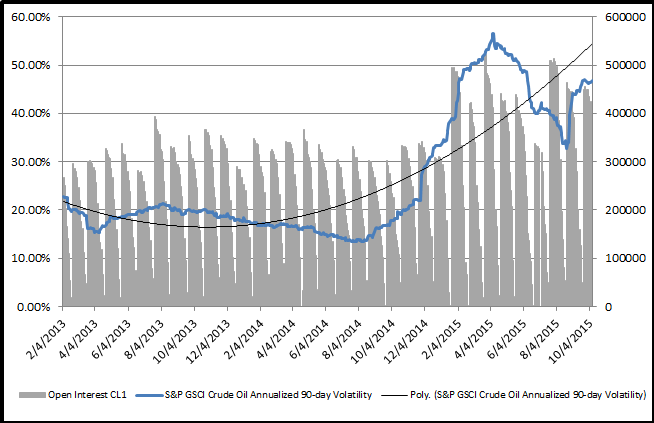
Last, one indicator that has historically crashed at the peak of volatility and oil bottom is open interest. It fell briefly but quickly elevated to its relatively high current level.

Source: S&P Dow Jones Indices and Bloomberg

Despite this, there are calls on oil that call a bottom in this quarter or next, and quote a range of $75 by the end of 2017.  PIRA energy group says the current market slump is setting the stage for prices to surge to $75 within two years, and below is a chart from Morgan Stanley of their oil market outlook, also showing oil in the $75 range for 2017.

Source: http://www.businessinsider.com/morgan-stanley-evolution-of-the-oil-cycle-through-2018-2015-9

So, what is the right call? S&P Dow Jones Indices isn’t in the business of making prediction but the indices are historical storytellers. A new family of indices, the S&P 500 Bond indices, has recently been introduced to help analyze companies and industries inside the S&P 500. Some of the sectors have significantly more equity, like technology, but some have more debt like utilities. Energy is pretty evenly matched, holding similar weights in each the stock and bond composite.

Let’s take a look at the performance relationships between the stocks and the bonds by using the S&P 500 Energy Total Return and the S&P 500 Energy Corporate Bond Index Total Return to see how the market views the equity risk premium, or in other words how strongly the market believes oil stocks will rise (equity performance) or fall (bond performance.) Historically the beta of the S&P GSCI Energy Excess Return (total return – T-bill) to energy stock alpha (S&P 500 Energy – S&P 500) is 1.05 and to energy bond alpha (S&P 500 Energy Corporate Bond Index – T-bill) s is 0.71, with respective correlations of 0.52 and 0.13.

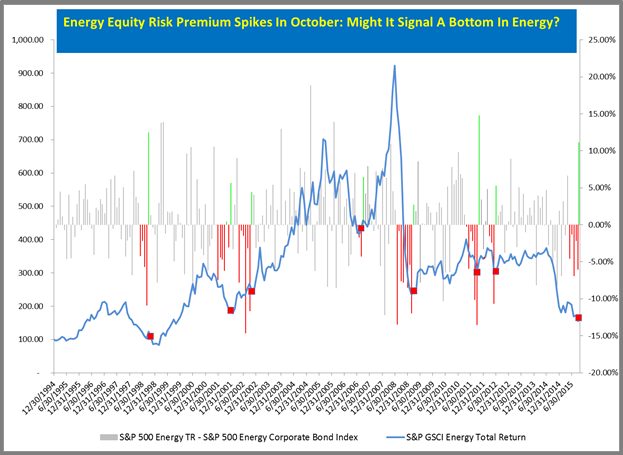
Below is a chart of the historical S&P GSCI Energy TR index levels versus the equity risk premium as measured by the S&P 500 Energy Total Return monthly minus the S&P 500 Energy Corporate Bond Index Total Return monthly. Notice the recent spike in the equity risk premium that has developed in Oct. The magnitude of the equity risk premium and spread change from a discount to a premium is the biggest since Oct. 2011, and the magnitude is the 8th largest on record with the 5th biggest swing.

Source: S&P Dow Jones Indices

Maybe oil is near a bottom, or maybe just that’s the market sentiment. To find out what the experts think visit the replay of the S&P Dow Jones Indices 9th Annual Commodities Seminar. To find out more about the S&P Dow Jones Bond Indices, click here, or click on one of these links if you’d rather watch a short video about the basics of the bond index, or about what is inside the broad bond index or about the bond sectors. Please let us know if you have any questions.


The posts on this blog are opinions, not advice. Please read our Disclaimers.

Most-Read Blog Posts Q3 2015

Contributor Image
Paul Murdock

Manager, Content & Delivery

S&P Dow Jones Indices

In case you missed them, we’ve compiled the most read blogs from the third quarter below.

Timing Gold Is A Fool’s Errand
Has gold reached its bottom?

Inside the S&P 500®…. Bonds!
What is the S&P 500 Bond Index and how does it compare to the iconic S&P 500?

China’s Currency Devaluation and Its Impact on the Indian Stock Markets
How has the devaluation of the Yuan affected the Indian economy and stock markets?

A Game of Thrones Using ETFs
Is there a schism in the ETF industry?

ETFs and Hedge Funds: At What Price Performance?
Why might hedge funds be losing the race for assets?

An Index Provider’s Perspective on the Growing Australian ETF Market
What index-based innovations are shaping the evolution of the Australian ETF market?

The posts on this blog are opinions, not advice. Please read our Disclaimers.

Why the S&P 500 Utilities Sector Shined in Q3

Contributor Image
Todd Rosenbluth

Director of ETF and Mutual Fund Research

S&P Capital IQ Equity Research

While the S&P 500 Utilities index has been one of the weakest in the S&P 500 index in 2015, in the third quarter it was a bright spot. As global economic concerns increased, we think investors found the domestic focused, stable dividend, and earnings provided by the sector appealing. While the Federal Reserve’s possible increase in the Fed funds rate could have an adverse effect, the 10-year Treasury yield has fallen back to approximately 2.0%. The average dividend for the S&P 500 utilities sector constituent was 3.9%.

The utilities index was down 8.6% year to date through September, worse than the 6.7% for the S&P 500 index. However, in the third quarter, the sector’s 4.4% increase was a stark contrast to the 6.9% decline for the broader market.

From a profit perspective, according to Capital IQ consensus estimates, the utilities sector is expected to post earnings growth of 0.9% for the third quarter of 2015 and 1.7% for all of 2015, both ahead of the S&P 500 index that is weighed down by energy and more multinational sectors such as consumer staples. The utilities sector is projected to increase EPS/earnings 7.0% in 2016, below the 10% for the S&P 500.

The utilities sector is known for maintaining relatively high payout ratios compared with the broader market. Since earnings growth may be constrained compared with sectors that introduce new products, such as health care or information technology, utilities tend to offer investors a higher dividend due to their relatively steady cash flows, and as an incentive to buy utilities shares.

According to S&P Capital IQ Equity Analyst Christopher Muir, payout ratios for the utilities sector have been higher than the S&P 1500. The five-year average payout ratio of 69.0% for the sector is more than double that of the S&P 1500.

Muir foresees continued high levels of capital spending by the industry, both on regulated and unregulated investments. Regulated capital spending includes spending on infrastructure replacement, new transmission and distribution facilities and lines, and regulated power plants, including new nuclear units currently under construction.

Unregulated spending will mostly focus on new natural gas-fired combined-cycle power plants, and investment in solar and wind generation is also likely.

While investors pulled money out of utilities sector ETFs in the first half of 2015, the sector had the second most inflows during the third quarter, behind energy. There are eight U.S. utility sector ETFs, though their exposures are distinct.

—————————————————————————————————–

S&P Capital IQ operates independently from S&P Dow Jones Indices.
The views and opinions of any contributor not an employee of S&P Dow Jones Indices are his/her own and do not necessarily represent the views or opinions of S&P Dow Jones Indices or any of its affiliates.  Information from third party contributors is presented as provided and has not been edited.  S&P Dow Jones Indices LLC and its affiliates make no representations or warranties of any kind, express or implied, regarding the completeness, accuracy, reliability, suitability or availability of such information, including any products and services described herein, for any purpose.


The posts on this blog are opinions, not advice. Please read our Disclaimers.

El Niño Won't Keep This Commodity Hot

Contributor Image
Jodie Gunzberg

Former Managing Director, Head of U.S. Equities

S&P Dow Jones Indices

Commodities have faced many headwinds this year from the strong U.S. dollar, high supply from OPEC and the slowing Chinese demand growth. The S&P GSCI Total Return hit a 15 year low in August, 23 of 24 commodities dropped in July and the 3rd quarter was the 3rd worst in history. For the year, all sectors are negative and all commodities are negative but one – that is cocoa.  However, cocoa may not stay hot for long.

In a note published a few months ago, agriculture was identified as the sector that performed best in periods following El Niño, and the performance is getting stronger through time with each successive El Niño.  Since that note, several questions have come in about which commodities inside the agriculture sector will perform best following the El Niño.

Below are some of the most popular questions with historical analysis of data going back to 1973 where available.  Cotton starts in 1977, Coffee in 1983, Cocoa in 1988 and Kansas Wheat in 2003. The El Niño data is from NOAA. In this analysis, there are 13 El Niño periods ending 1973, 1977, 1978, 1980, 1983, 1988, 1992, 1995, 1998, 2003, 2005, 2007, 2010. Below is a table of spot returns of commodities in the agriculture sector of the S&P GSCI:

Source: S&P Dow Jones Indices
  • Which agricultural commodity is affected the most from El Niño? Generally, the volatile weather brought by El Niño has disrupted the crop yields that has pushed prices higher. Wheat and Kansas Wheat have historically been most impacted, though all agricultural commodity returns have benefitted from El Niño except cocoa.
  • Following the previous question, what kinds of agricultural commodities have gained or dropped due to El Niño? Why is that and what’s the price fluctuation range respectively? In order of highest average historical return in the 12 months following El Niño: Kansas Wheat, Wheat, Corn, Soybeans, Sugar, Coffee and Cotton. Only Cocoa has dropped historically following El Niño periods. In the 12 months following El Niño periods, cocoa has lost on average 35 basis points and Kansas Wheat has gained on average 72%. It depends on the specific weather pattern impacting supply, individual demand models per commodity, perishability and storage capacity.
  • For those affected commodities, how long does it take to show the price spike/plunge after the effect occurs? For most of the agricultural commodities, the price increases start happening soon after the El Niño. Cotton is the slowest to be impacted, taking over 3 months post the El Niño periods. Wheat is the quickest to be impacted, followed by corn. Again, cocoa doesn’t perform any better from El Niño periods.
  • Is there any signs based on which investors can determine the timing for investment? The main signal has been detrimental weather that disrupts the crop production. Watching weather patterns in regions where the specific crops grow and learning how supply is disrupted helps determine timing. It is important not to forget other drivers of supply and demand, like the imbalance of powder to butter in the cocoa market from the demand growth of high-end chocolate.
  • This year’s El Niño is considered to be the strongest in decades, what’s your suggestion to investors to prepare for the climate impact?  Historically, investors and consumers protect themselves in different ways. In some cases, food processors hedge so the price impact does not flow to the retail consumers. In other cases, investors may use agriculture and other inflation sensitive commodities to diversify their risk. Last, some consumers have protected themselves by buying frozen goods and storing them until prices return to lower levels.


The posts on this blog are opinions, not advice. Please read our Disclaimers.

Dow Jones Industrial Average Q3 2015 Performance Report Card

Contributor Image
Jamie Farmer

Former Chief Commercial Officer

S&P Dow Jones Indices

The Dow Jones Industrial Average ended September at 16,284.70 – down 1,538.37 points year to date for a -8.63% return. Q3 2015 was the worst calendar quarter since Q3 2011.

  • Leader & Laggard – Nike (NKE) was the biggest contributor during Q3; Goldman Sachs (GS) was the biggest detractor.
  • Industry Performance – the Consumer Goods industry was the best (and, frankly, only) contributor during the period; Industrials the worst.
  • Worst Day (In Points & Percent) – down 588.40 points or -3.57% – on August 24th. While bad – the worst 1 day loss since August 2011 – it could have been worse: the DJIA was down over 1,000 points in early trading before recovering.
  • Best Day (In Points & Percent) – a mere two days later, on August 26th, the DJIA finished up 619.07 points or 3.95% as investors were drawn back to the markets following a period of panic selling.
  • No New Highs – Q3 saw no new highs for the DJIA, the last having been struck on May 19, 2015.

Capture

Download the full report

The posts on this blog are opinions, not advice. Please read our Disclaimers.