Get Indexology® Blog updates via email.

In This List

OPEC's Decision Might Backfire

Historical Impact of Australian Taxes on Returns

Energy Stocks Might Be The Wrong Play As Oil Rises

Who’s in charge of your investments – Captain Kirk or Mr. Spock?

Will Greece Default, And Does It Matter?

OPEC's Decision Might Backfire

Contributor Image
Jodie Gunzberg

Former Managing Director, Head of U.S. Equities

S&P Dow Jones Indices

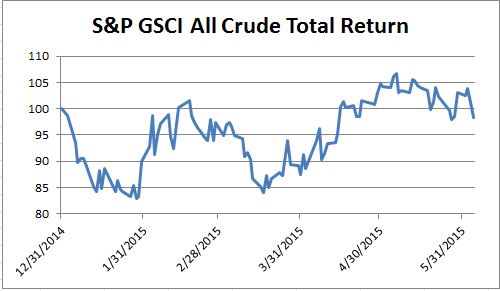
In light of the decision by OPEC (Organization of the Petroleum Exporting Countries) to maintain its 30 million barrel-a-day production level, the S&P GSCI All Crude lost 4.5% this week, bringing its year-to-date return down to -1.7%, back into negative territory. A status the index has not been able to maintain for more than 3 consecutive days since April 10 – that was 40 days ago.
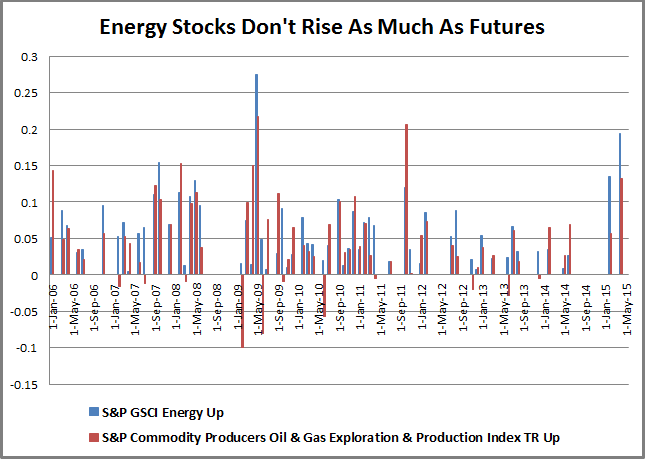
Chart 1

Source: S&P Dow Jones Indices

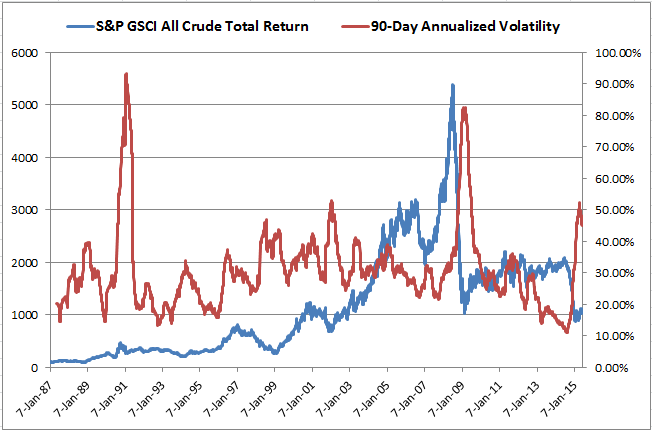
This is evidence of the volatility that oil is experiencing right now, as you can see in the chart below. While today’s volatility is not the highest in history, it is now more than 45% – that is significantly higher than the historical average of about 30%.  At this level, it appears, the volatility is too much for investors to bear, so managers are cutting their bets.  Will this drive oil prices even lower than the OPEC supply itself?

Chart 2

Source: S&P Dow Jones Indices. Daily data from Jan. 7, 1987 - June 4, 2015.
Source: S&P Dow Jones Indices. Daily data from Jan. 7, 1987 – June 4, 2015.

The price formation of oil is dependent on volatility as the market tries to stabilize.  What happens as OPEC continues to flood the market from a pure supply and demand standpoint is fairly obvious. Total supply increases, and until production is reduced enough from non-OPEC suppliers and inventories are drawn down or demand increases, the oil price most likely drops. However, the speculators play an extremely important role in production decisions impacting oil supply.

As Hilary Till pointed out in a comment to the FT, the role of a speculator has been debated for decades.  Two of the most well-known research papers on the subject come from Paul Cootner of MIT and Holbrook Working of Stanford in the 1950’s and 60’s. The result of their research says everyone who hedges is a speculator but the risk taking is more specific to different market participants. For example, a producer does not eliminate his risk in the futures market but creates a basis risk that is the difference between the spot and futures price which is more predictable to manage.  This is important since it allows the producer to hold more inventories than would otherwise be possible.

The above explanation is precisely why OPEC’s decision to continue to produce oil can backfire and spike the oil price. One more time, WHY?

As production stays high, the oil price drops, the volatility picks up so investors pull out. If investors pull out, then the oil price might drop more, right? WRONG! 

The supply and demand should be unaffected by commodity futures investing since there is no physical delivery from commodity futures investing. Remember, though, that speculators play an important role in risk transfer. As the volatility spikes, investors no longer are motivated to take the risk (go long futures contracts) of supplying insurance to the producers (who are short the contracts to protect against oil price drops.) The result is a collapse in open interest as shown in the charts below that compare volatility spikes with open interest (they are time period close ups of the above graph):

Chart 3

Source: S&P Dow Jones Indices and Bloomberg. Daily data from May 15, 1987 - June 4, 2015.
Source: S&P Dow Jones Indices and Bloomberg. Daily data from May 15, 1987 – June 4, 2015.

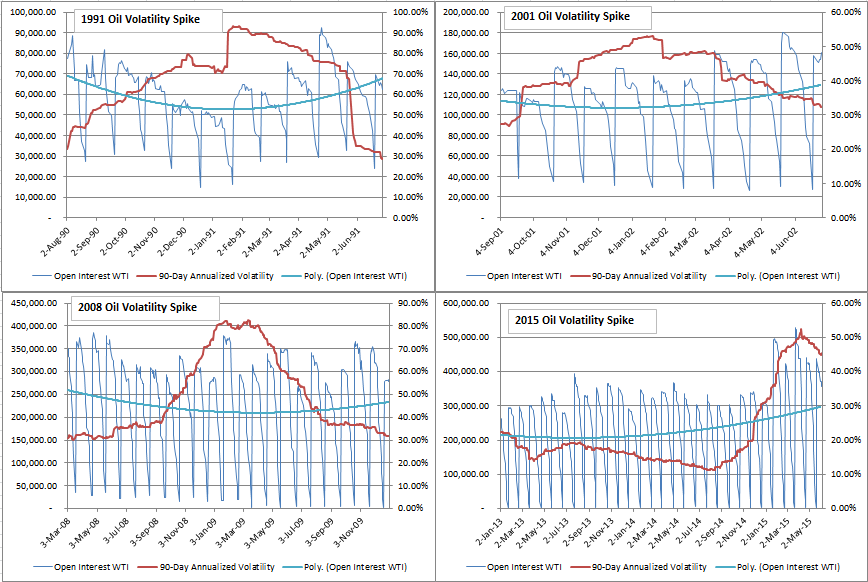
From the charts 2 and 3, one can observe that oil price spikes precede high volatility that causes open interest to collapse. Once investors take risk off the table and open interest collapses, then producers are less motivated to produce and store since insurance is more expensive. Then supply diminishes and the problem of low oil price solves itself as demonstrated in chart 2.

Where are we in this cycle? It appears from the 2015 oil volatility in chart 3 that the open interest has not collapsed yet. This means there may be further increased volatility until more money exits the futures market. OPEC’s decision to continue production may accelerate this exodus. When we finally see open interest collapse, then we may find the bottom of oil prices.

Finally, one tidbit that has been pointed out before is that VIX is the performer during this type of environment of high oil volatility, especially post the global financial crisis. Just this month as oil crossed into negative territory, VIX is up 1.6%.


The posts on this blog are opinions, not advice. Please read our Disclaimers.

Historical Impact of Australian Taxes on Returns

Contributor Image
Harry Chemay

Co-Founder & CEO

Clover.com.au

This is the second blog in a series on the evolution of Australia’s tax-aware investment management (TAIM) landscape.

One historical record of the impact of taxes on returns in Australia is the annual Russell Investments/Australian Securities Exchange (ASX) Long-term Investing Report, which measures pre- and post-tax returns for various asset classes over 20-year periods.  The returns for a selection of asset classes from the most recent report are depicted below:

Capture

The chart above shows the annualised inflation-adjusted index returns for Australian shares, fixed interest, and cash on a pre-tax basis, together with how those returns changed with the impact of taxes for two different types of taxpayers; superannuation funds (in accumulation mode) and an individual on the highest marginal tax rate(MTR).

The data indicates that Australian shares returned 6% p.a., after inflation, from December 1993 –December 2013, significantly ahead of Australian fixed interest at 4.1% p.a., and cash at 1.1% p.a.  Once taxes are incorporated however, things start to look markedly different. An individual on the highest MTR had 1.8% p.a. removed from the pre-tax return, while a super fund received a tax-derived 0.4% p.a. boost to the index return for the entire 20-year period.

Fixed interest investors received not the 4.1% p.a. the market delivered, but either 0.8% p.a. or 3% p.a., depending on their tax status.  As for cash investors, the 1.1% p.a. market return was either halved or actually turned negative due to the tax effect.

To learn more about how to weigh your after-tax benefits, visit www.spdji.com/tax-aware.

The posts on this blog are opinions, not advice. Please read our Disclaimers.

Energy Stocks Might Be The Wrong Play As Oil Rises

Contributor Image
Jodie Gunzberg

Former Managing Director, Head of U.S. Equities

S&P Dow Jones Indices

The headline story in oil is that it settled at its highest level of the year. Prices got a boost from a weaker U.S. dollar and there is an expectation in the market that weekly data will show a decline in U.S. crude inventories. The next story is that energy stocks rallied on higher oil, but historical data shows that energy stocks may not be the best bet to play an oil rally.

Of course, energy futures and oil and gas producing stocks, are related as evident in the chart below, but it may not be as much as expected. The correlation is 0.79 between the S&P GSCI Energy and S&P Commodity Producers Oil & Gas Exploration & Production Index TR, using monthly data from Dec 30, 2005 – May 29, 2015. There are influences on stocks of producers that may not be related to the oil price but aim to maximize shareholder value. For example, decisions on dividends, debt/equity ratios or even hedging out the price of oil may drive the stock price independently from the underlying oil price. Source: S&P Dow Jones IndicesSource: S&P Dow Jones Indices

The annualized volatility of the stocks of producers is basically the same as the futures at 28% versus 29% but for every 1% move in oil futures (up or down), the stocks only move 74 basis points as measured by beta. What is more interesting to study is how oil stocks perform versus oil futures in up and down markets. On average in a down month for oil, futures drop 6.8% versus only 4.9% for the stocks; however, when oil rises, futures rise 6.1% on average in a month but stocks only rise 4.9%.

Source: S&P Dow Jones Indices

The bottom line is if oil is dropping, stocks may be the safer way to play, but when oil is rising, it might be time to switch to futures.


The posts on this blog are opinions, not advice. Please read our Disclaimers.

Who’s in charge of your investments – Captain Kirk or Mr. Spock?

Contributor Image
Philip Murphy

Former Managing Director, Global Head of Index Governance

S&P Dow Jones Indices

I have a confession – earning the market return minus expenses does not feel very enticing. Reasonably well-run index funds will do just that, and probably land within the 2nd or 3rd performance quartile year in and year out. But is that the best I can do? Where’s the satisfaction? My inner Captain Kirk wants an investment that will crush the market.

On the other hand, my inner Spock guides me to observe empirical data and apply logic. And Mr. Spock is telling me that if I want to compound returns effectively over time, which is the only way I know of to grow wealth, indexing is my friend. Here’s why:

Look at the odds. In every period there are some active managers that outperform the market. But the chances of picking a manager that outperforms in the next period and into future periods are quite slim. Here’s a table showing results of active small-cap funds from our December 2014 issue of Persistence Scorecard:

Persistence Table

Almost 30% of 1st quartile small-cap funds, as of September 2011, had fallen to the 4th quartile as of September 2014. Only 22% repeated their 1st quartile performance. Random odds would give a 25% chance if funds did not close, merge, or liquidate. The persistence data shows that active small-cap managers tend to move about in terms of their relative standing. It’s quite likely that if one is fortunate enough to invest with a 1st quartile manager in one period, the manager may fall in performance rankings in future periods.

Do the arithmetic of compound returns. I downloaded 3-year annualized total returns, as of April 2015 based upon monthly data, of small-cap active and passive mutual fund share classes in the Morningstar database. My sample is not adjusted for survivorship, so active returns appear better than actual experience. I then created a hypothetical example showing the impact of investing $1000 and earning the median of 1st quartile returns (the 87.5th percentile) of active small-cap share classes for a 3-year period, and earning the median of 4th quartile returns (the 12.5th percentile) of active small-cap share classes for the following 3-year period. I compared this investment with another where I invested $1000 and earned the median 3-year annualized return (the 50th percentile) of all small-cap index fund share classes for six years. Here are the results of my hypothetical example:

Compound Growth

After three years, the active strategy is winning by $86. But by the fifth year the slow and steady median small-cap index fund is out in front by $33. After the sixth year, the active strategy is behind by $121. Maybe earning consistent 2nd – 3rd quartile returns is not so dull after all. In any event, I’m betting that maximizing my chances to “Live long and prosper…” will lead to more lifelong satisfaction than going for short term emotional gratification. Sorry Captain Kirk.

I’m presenting this material, along with some related ideas this Thursday afternoon during a complimentary webinar, “Not All Small-Cap Indices are Created Equal,” hosted by S&P DJI.

The posts on this blog are opinions, not advice. Please read our Disclaimers.

Will Greece Default, And Does It Matter?

Contributor Image
Tim Edwards

Managing Director, Index Investment Strategy

S&P Dow Jones Indices

Once again, Europe’s banking and finance chiefs are hunkered around the negotiating table. The Greek prime minister is optimistic a deal can be reached, the German finance minister dismissive. A debt payment is due; it is two minutes to midnight.  The markets are hanging by a thread on the outcome.

Writing the news is getting easy – just cut and paste from the last time a Greek payment was due.

You could be forgiven for assuming nothing has changed, and a deal should be expected in the final hours of the latest crisis. This is at least an empirical approach.

But there are important distinctions to be drawn between the current impasse and previous ones.  If Greek equities, Greek bonds and Greek GDP disappeared, it would certainly be a tragedy, but not of epic and globally destructive proportions.  And it is more likely that Greece will default precisely because it is now bearable.

It is bearable because the IMF and the European Central Bank now own pretty much every bond on which the Greek government can default.  There other holders, but not many of them. By now, each knows the risks.

It is bearable because, while Europe’s equity markets as a whole amount to EUR €10 trillion,  our broad-based equity index for the region, the S&P Greece BMI, comprises just 39 stocks with a combined free-float market capitalization of EUR €19.7 billion – about two one-thousandths of the former.

It is bearable because the GDP of Greece is now less than 1.5% of Europe’s – an amount otherwise sufficient to distinguish a great quarter of growth from a one of mild disappointment.

Of course, the risks of a Greek default have always been in the unknowable, the fall in confidence, the “contagion” —  the secondary consequences.  And it is in this respect that the world is different. Europe’s economy overall is growing again, and is more immune to shock.  The majority of the region’s banks have completed stress tests in 2014 that, unlike the 2011 equivalents, explicitly tested robustness in the event of a default by Greece’s government.  The financial markets have had ample time to prepare for downstream effects.  Most importantly,  the economies and markets viewed as most likely to suffer from contagion —  Ireland, Italy, Portugal and, to a lesser extent, Spain – are looking much healthier.  It is harder to see the next domino to fall.

In short, a Greek default looks more palatable today than at any point since this crisis began.  And that is important precisely because political forces are at the heart of negotiations.  If a default is more economically bearable, it is more politically feasible.

Europe does not want Greece to default, but it is a balance.  The scales are now differently tipped. The Greek government does not wish to default either. But they were elected to renegotiate the terms of the current bailout agreements, remain in the euro currency block and to “end austerity”.  If not all of those objectives can be achieved, they may well see the last objective as paramount.  If a last minute deal is found, our headline can be put back into storage to be ready for the next crisis.

Thus characterized: a Greek default might indeed occur, but only if it doesn’t really matter.

The posts on this blog are opinions, not advice. Please read our Disclaimers.