It has been over nine years since the Fed raised interest rates, but today, the Fed raised rates just as expected. While the Fed actions have been well telegraphed, and interest rates are probably the least of worries for commodities, there is one measure that might be worrisome.
Although since 1991, rising rates seem not to have been a decisive factor in equity performance, and have clearly not been a negative force (as shown in the chart below from this paper,) there is more uncertainty about the stock market today than tomorrow.

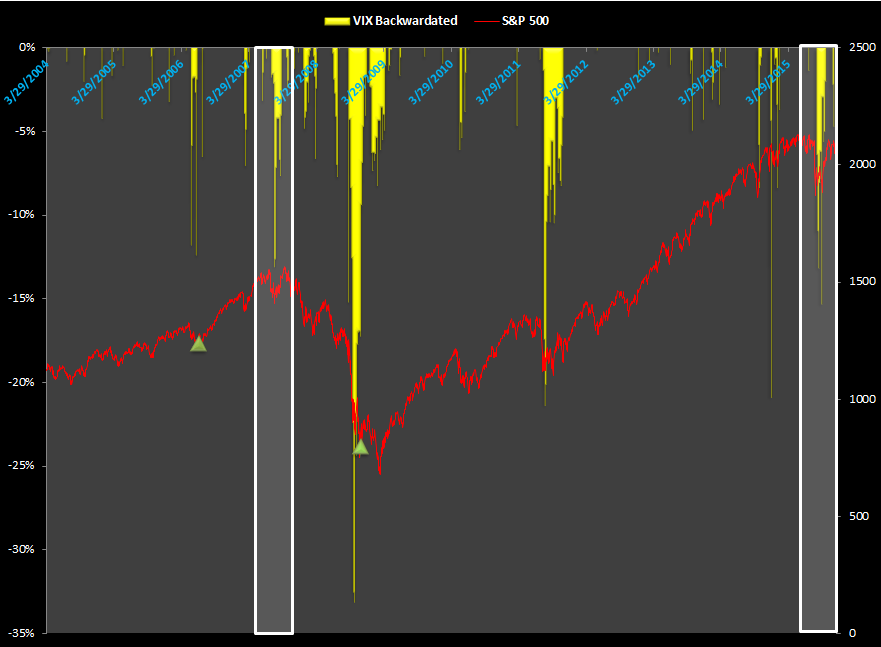
One indicator of extreme market stress can be seen when the price of futures contract on the CBOE Volatility Index® (VIX) with a nearby expiration is more expensive than one later dated. This condition is called backwardation (it sounds like a bad diagnosis and usually is) but it is relatively rare, happening in only 17% of days since Mar. 29, 2004.
The futures contracts are now reflecting this condition for five days straight. This has happened a number of times before but one of the interesting things about today is that the market seems not only uncertain but downright jittery. It looks a bit like in 2007, soon after the Fed starting raising rates, when the market felt noticeable fear by the measured backwardation. It’s not the fear alone but the persistence. Just a few months ago, from Aug. 20 – Oct. 7, the Chinese stock market crash sent chills through the market. Backwardation appeared again from Nov. 13 – 16 with one of the biggest weekly stock market drops in months that crashed the S&P 500’s 200-day moving average, a bearish signal for many investors. Again, ahead of the Fed decision – which should not have been surprising – backwardation appeared and is present. The chart below shows the history of VIX backwardation with the S&P 500 index levels. The green triangles represent when the Fed raised rates in 2006 and when they started quantitative easing in 2008.
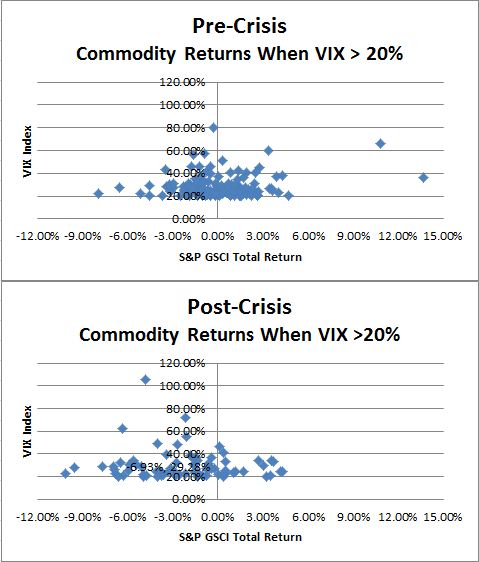
While the interest rates alone have not influenced stock prices, the unprecedented quantitative easing started a vicious cycle of risk-on/risk-off (RORO) that was the result of a binary outcome for risky assets – either the easing works OR it doesn’t. Since commodities are a risky asset, they are a class where the returns are noticeably impacted by fear before the financial crisis and after, when quantitative easing began. Pre-crisis, there was no relationship between a high VIX and commodities, but the relationship turned negative post-crisis.
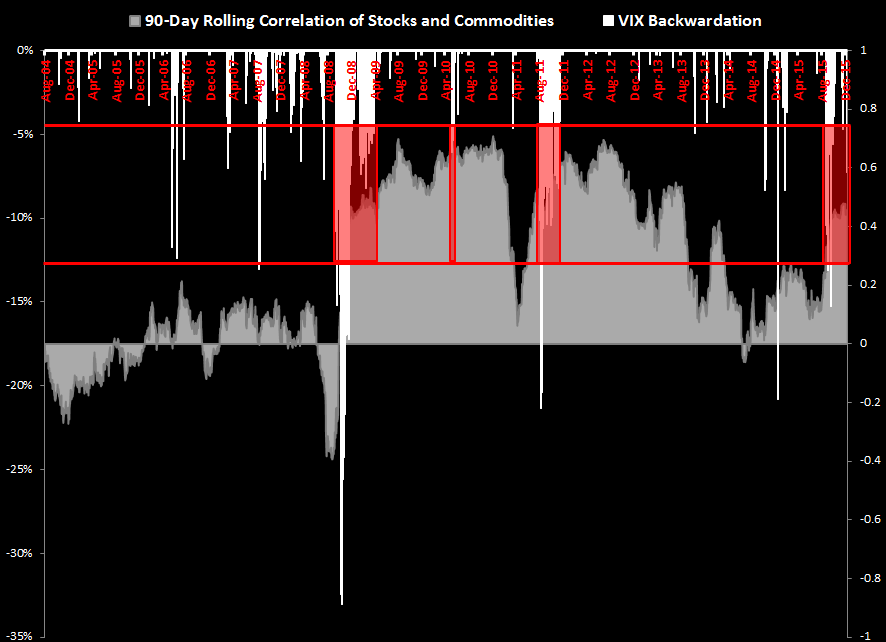
The RORO environment meant investors either felt they were, or were not getting paid for taking the risk to invest in risky assets. This drove up the correlation of commodities with stocks to unprecedented levels, just over 0.7. By 2013, the Fed started to taper and the correlation fell back to zero, and stayed below its average of 0.26 until Aug., 2015, precisely when VIX backwardation appeared. In just slightly more than one month, the correlation doubled from 0.22 (Aug. 20, 2015) to 0.44 (Sep. 28, 2015). Since then, it has increased slightly more to 0.46, its highest level in over two years, since Aug. 20, 2013.
The one thing to worry about is the combination of higher than average VIX backwardation with high risky-asset (stock/commodity) correlation. This only happened three times before now. Once in the financial crisis, once in 2011 just following the debt ceiling crisis and U.S. downgrade, and for a very short time in the 2010 flash crash. This is illustrated in the chart below where the S&P 500 represents stocks and the S&P GSCI represents commodities.
The posts on this blog are opinions, not advice. Please read our Disclaimers.