Get Indexology® Blog updates via email.

In This List

The Rieger Report: Munis lead the pack in the final lap

The Rieger Report: Junk Bond Trading Concentration & Impact on Liquidity

Investing and the Paradox of Skill

Now Might Be the Time for VIX®

The Rieger Report: Cost of Buying Default Protection in Energy Sector Up 185%

The Rieger Report: Munis lead the pack in the final lap

Contributor Image
J.R. Rieger

Former Head of Fixed Income Indices

S&P Dow Jones Indices

As 2015 inches closer to the final bell U.S. municipal bonds are leading the returns as we near the halfway point of the final lap.

As of December 14th, 2015….

The S&P Municipal Bond Investment Grade Index has recorded a total return of 3.09%.  Key factors for the muni market in 2016 include:

  • Real new issue supply excluding refunding bonds could grow in 2016.  This would be a welcomed sign for the muni market but will test the demand side of the equation.
  • Demand for better quality municipal bonds has been strong and could remain strong in 2016.
  • Defaults in the municipal segment are few but make powerful headlines.  Puerto Rico remains the largest drag on the overall muni market.  These events should support the higher grade portion of this market.

The S&P Municipal Bond High Yield Index has also shown positive returns of 2.51%.  Key factors for the junk muni bond market in 2016 include:

  • Puerto Rico resolution or steps toward resolution.
  • Low real new issue supply of higher yielding municipal bonds helps keep the imbalance between demand for yield and supply off kilter.

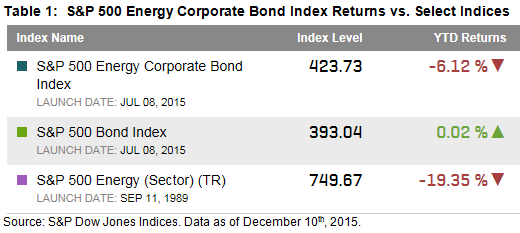
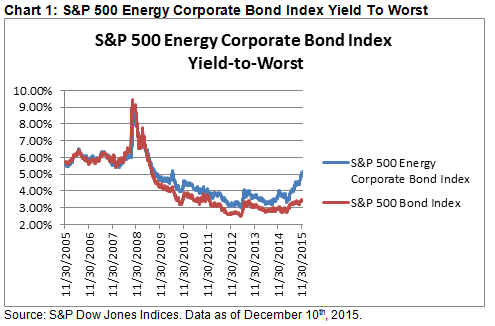
U.S. Corporate bonds tracked in the S&P 500 Investment Grade Corporate Bond Index have just about returned 0% and the S&P 500 High Yield Corporate Bond Index has returned -4.68% so far in 2015.  The market for these bonds in 2016 may be affected by:

  • Expected lower new issue supply of investment grade bonds.
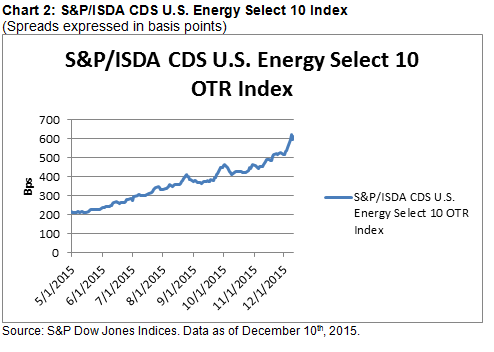
  • A decline in the energy bond and mining related debt markets.
  • Rising rates impacting the yield curve: i.e. flattening or steepening the curve.  Expectations are that flattening is more likely.
  • Credit spreads widening in the junk sectors.

Table 1:  Select Fixed Income Indices Yields and Total ReturnsMuni Performance 12 2015

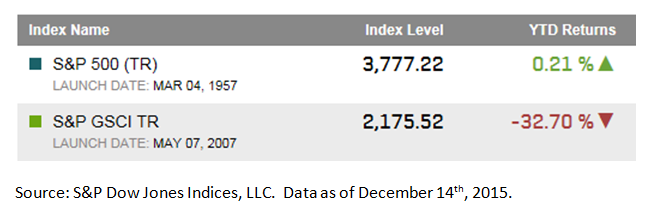
Table 2: S&P 500 and S&P GSCI Total Returns

Asset classes 12 2015

The posts on this blog are opinions, not advice. Please read our Disclaimers.

The Rieger Report: Junk Bond Trading Concentration & Impact on Liquidity

Contributor Image
J.R. Rieger

Former Head of Fixed Income Indices

S&P Dow Jones Indices

The concentration of bonds trading in the secondary market rises the weaker the credit quality of bonds.

The distressed segment of the junk bond market has the most concentrated trading activity indicating that the majority of bonds in that segment are significantly less liquid.

The top 20% of bonds in the S&P U.S. Distressed High Yield Corporate Bond Index in November represented:

  • 86% of the total number of trades that occurred in that quality segment.
  • 75% of the total market value of trades that occurred in that quality segment.

For comparison, trade data for other quality based indices is in the table below.

Table 1: Select Indices and Corresponding Trade Volume Statistics on the Bonds In Those Indices (Month of November 2015).HY Indices Trading Volume 12 2015


The posts on this blog are opinions, not advice. Please read our Disclaimers.

Investing and the Paradox of Skill

Contributor Image
Harry Chemay

Co-Founder & CEO

Clover.com.au

With the release of the latest SPIVA® Cross-Country Comparison results, the debate between active and passive investment management has once again ignited.  Proponents of passive management point to the SPIVA data as evidence of the inability (in aggregate) of asset managers worldwide to beat relevant passive indices over meaningful periods of time.  Meanwhile, proponents of active management suggest weaknesses in the passive approach, including the potential for active management to protect “on the downside” relative to index-weighted portfolios.

There are real dollars riding on winning the active versus passive argument.  Every time the debate re-emerges, battlelines are drawn and positions are defended vigorously around one question: is it possible to outperform on a risk-adjusted basis (generate “alpha”) consistently over an extended period of time?

Alpha is the part of a security’s return that remains after accounting for all known embedded risk factors.  Why is it seen as the pinnacle of investing?  Because in a world where we are told there are “no free lunches,” alpha is just that; a return component above that required for bearing all known risks, and thus attributed to investment skill.

In a competitive market where everyone has access to the same information and acts on it with equal speed, alpha can indeed be a sign of skill.  It could just as easily be a product of luck.  Over short periods of time, investment skill is indistinguishable from luck.  The longer a fund manager consistently delivers alpha, the more probable it is that skill rather than luck explains the alpha.

The case for passive investing is often held to rest on the Efficient Market Hypothesis (EMH).  It suggests that in a market that is efficient, all relevant information is already incorporated into each security’s current price, and any new information will be incorporated too fast to consistently act on and profit from.

While some proponents of active management view EMH adherents as nay-sayers lost in the axioms of their own theoretical world, the disdain is not reciprocated.  EMH is a vindication of the competitive spirit of capital markets, not a criticism of it.  Alpha is hard to find precisely because there are so many highly intelligent and extremely motivated people looking for it.

In 1979, according to the Investment Company Institute, there were some 530 mutual funds in the U.S.  By 2013, this number had increased 14 fold to exceed 7,500 funds.  Asset management has been a favored destination for MBA graduates the world over for at least the past two decades.  They, along with CFA charter holders and those with doctorates in physics and applied mathematics, compete for entry into the lucrative world of asset management.

Yet, armed with all this prodigious human talent together with the fastest computational technology, alpha has become harder to consistently generate.  Why?

The answer may lie in the “paradox of skill,” a phenomenon that has been observed in competitive arenas such as professional sports.  The crux of this paradox is that as time passes and competition intensifies, the skill level of the average participant increases.  Importantly however, the spread of skill, from the most talented to the least, reduces with time.  In an environment where the absolute skill level is rising while the relative skill level is in decline, luck starts to play a larger role in outcomes.

Take baseball.  Why has no player in Major League Baseball had a batting average over .400 since Theodore “Ted” Williams of the Boston Red Sox hit .406 in the 1941 season, despite pros becoming far better conditioned over the intervening 70+ years?

In a similar fashion, the batting average of legendary Australian batsman Sir Donald Bradman of 99.94 runs (from 1928-29 to 1948) has never been matched in the modern era, where an average above 50 is rare.

Both Williams and Bradman were superb athletes of their day, yet it is unlikely that they would have been able to replicate their stats against the average opponent of the modern era.

The dawn of professional sport heralded a revolution in training, diet, physical and mental conditioning, and data analytics.  The result is an overall skill level in elite sports today incomparably higher than the past, yet without the most skilled players able to dominate as they could in previous eras.

A similar force is at work in professional investment management.  The average fund manager today is the financial equivalent of a professional athlete, with every advantage that a high IQ, elite education, and rigorous training can bestow, and yet despite all these attributes, the SPIVA results are unequivocal.  The ability to beat the market on a risk-adjusted basis consistently over time, especially after fees and taxes, isn’t getting any easier.

Blame it on the paradox of skill.

The posts on this blog are opinions, not advice. Please read our Disclaimers.

Now Might Be the Time for VIX®

Contributor Image
Marya Alsati

Former Product Manager, Commodities, Home Prices, and Real Assets

S&P Dow Jones Indices

An alarming picture is being painted by an economically frail global economy: the threat of a U.S. Fed rate hike and renewed credit weakness driven by falling oil prices.  The S&P GSCI® (TR) was down 30.8% YTD, with all sectors in the index reporting negative returns for the year, but the S&P 500® and the U.S. stock market have not collapsed yet.  In fact, U.S. equities are on pace to outperform commodities for the eighth consecutive year, which would set a new record.  If this cycle changes, investors may need a way to protect themselves.

Historically, the CBOE Volatility Index® (VIX), which many investors know as the “investor fear gauge,” tends to spike when markets are tumultuous.  VIX measures the expected 30-day volatility of the S&P 500.  When implied volatility is high, the intraday moves can be large, and when implied volatility is low, intraday ranges tend to be narrow.

Since 1990, the S&P 500 has dropped in 37% of months (115 out of 300) and on average, when it fell, it lost 3.5%.  When VIX gained, it gained an average of 16.4%.  In October 2008, the S&P 500 lost 16.9%, its worst month on record, while VIX gained 52.0% in the same period.

Exhibit 1 shows VIX and S&P 500 returns when equities are in negative territory.  It can be seen that in most cases where S&P 500 returns are negative, VIX returns are positive.

Capture

Since the current commodity crash has played a major role in slowing global growth, it is important to note that VIX could also protect against drops in commodity prices.  Since 1990, the S&P GSCI has fallen in 46% of months (142 out of 311).  In those months, on average, commodities fell 4.7% and VIX gained 3.4%.  Exhibit 2 shows VIX and S&P GSCI (TR) returns; when commodities are in negative territory, it can be seen that in most cases VIX returns are positive.

2

Volatility indices like the S&P/ASX 200 VIX, the S&P/JPX JGB VIX, and the S&P/TSX 60 VIX could offer similar protection globally.

The posts on this blog are opinions, not advice. Please read our Disclaimers.

The Rieger Report: Cost of Buying Default Protection in Energy Sector Up 185%

Contributor Image
J.R. Rieger

Former Head of Fixed Income Indices

S&P Dow Jones Indices

Some high yield bond funds are reeling with the impact of the price of oil on energy related companies with debt.  The S&P 500 Energy Corporate Bond Index, tracking over $255billion in debt, is down over 6% year-to-date while the overall S&P 500 Bond Index remains in positive territory.  Energy bonds have been less volatile than the stock of these companies but a 6% drop is painful for bond investors.

12 10 2015 Table 1

12 10 2015 Chart 1

More telling is how the credit markets are viewing the cost of buying default protection on the debt of energy related companies.  The cost of buying default protection has risen by 185% since May 1st, 2015 indicating the credit markets are expecting more distress in the sector over the near term.  Based on the index the cost per $100,000 of protection on May 1, 2015 was $2,130 and the cost per $100,000 of protection on December 10th was $6,080.

12 10 2015 Chart 2


The posts on this blog are opinions, not advice. Please read our Disclaimers.