China’s onshore bond market, the third-largest debt market in the world and trailing only behind the U.S. and Japan, is an important market for international investors, given that China is the second-largest economy in the world. However, historically foreign ownership of Chinese bonds in the domestic market has been negligible, largely due to a lack of market access for foreign investors. As of November 2018, foreign ownership in China’s onshore inter-bank bond market was at 2.5%.[1]
With China opening up its onshore bond market for foreign investors, key progress on the issue of market access was achieved in the second half of 2018. This progress included the implementation of delivery-versus-payment, block trading, and the clarification of tax treatment. Progress on these issues cleared some significant roadblocks for foreign investors to access Chinese onshore bonds, which could promote foreign inflows into China’s bond market in the years to come. In fact, foreign ownership of Chinese bonds in the inter-bank market has increased by 46% and 450 billion RMB (65 billion USD)[2] since the end of 2017 as of November 2018, even though other emerging markets are facing outflows in 2018.
In 2014, S&P Dow Jones Indices launched the S&P China Composite Select Bond Index as a benchmark that is designed to represent high-quality bonds with reasonable liquidity traded onshore in China. The index includes bonds issued by the Chinese central government, three Chinese policy banks, and Central State-Owned Enterprises (CSOEs[3]), and it effectively covers bonds of sovereign and quasi-sovereign credit quality.
Our goal in this blog is to use the S&P China Composite Select Bond Index to examine the performance profile and diversification effect of high-quality Chinese onshore bonds from the perspective of a US investor.
Exhibit 1 displays trade-offs between return and volatility for the S&P China Composite Select Bond Index and other major U.S. asset classes. From August 2013 to November 2018, Chinese onshore bonds had an annualized return of 2.2% and volatility of 4.0%, as compared to an annualized return of 0.9% and volatility of 4.4% for the Bloomberg Barclays Global Aggregate Bond Index.
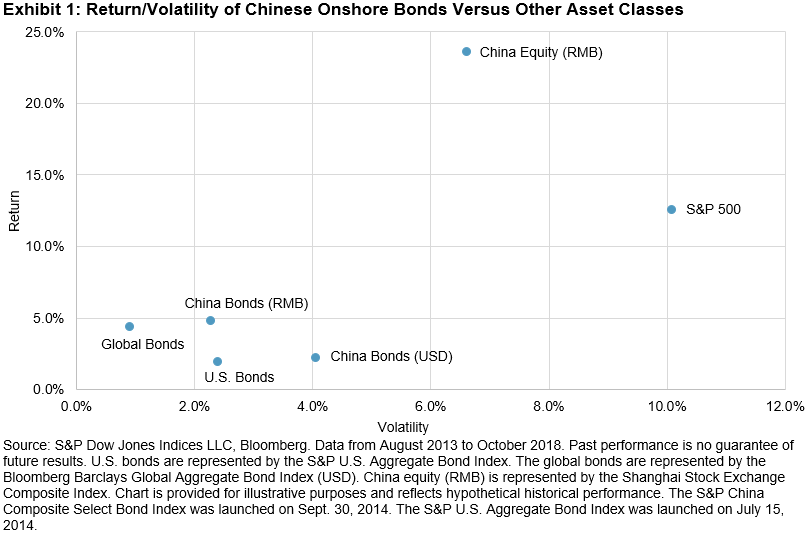
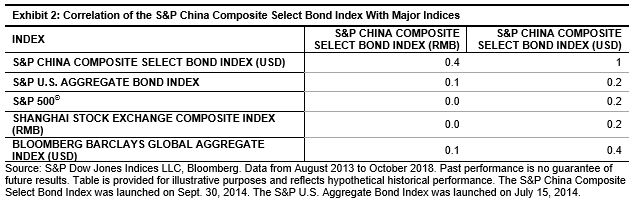
Exhibit 2 shows the correlation of the S&P China Composite Select Bond Index in both RMB and USD terms with major U.S. asset classes since August 2013.[4] We noted the following findings.
- The correlation between the S&P China Composite Select Bond Index returns in USD and RMB is 0.4, which indicates that bond returns in RMB explained 13% of variation for total returns in USD terms for the index. Currency risk contributed to the majority of return variation for RMB-denominated bonds when currency risk was unhedged.
- The correlation between the S&P China Composite Select Bond Index returns in either USD or RMB with U.S. equities and U.S. bonds were both relative low, ranging from close to 0 to 0.2. This exemplifies the potential diversification benefit of having Chinese sovereign and quasi-sovereign bonds in a U.S.-focused bond or equity portfolio.
- Chinese onshore bonds and stocks are good potential diversification options for each other, as returns from both markets when expressed in RMB shows near zero correlation.
- The S&P China Composite Select Bond Index returns in USD correlated with the Bloomberg Barclays Global Aggregate Bond Index at 0.4, which could argue for the potential diversification benefit of having China’s government and quasi-sovereign bonds in a global bond portfolio.
[1] Source: http://www.chinabond.com.cn/
[2] Source: http://www.chinabond.com.cn/
[3] CSOEs are defined as Chinese corporations directly governed by the State-Owned Assets Supervision and Administration Commission of the State Council.
[4] The first value date of the S&P China Composite Select Bond is Aug. 30, 2013.
The posts on this blog are opinions, not advice. Please read our Disclaimers.