By now, the news in early November about the collapse of FTX, one of the largest global cryptocurrency exchanges, is sinking in. At S&P Dow Jones Indices, we often discuss the challenges of the cryptocurrency ecosystem and its risks across multiple dimensions. These include asset-level risks, technology risks, market risks and regulatory risks, as well as unknown and sizeable systemic risks. As the fate of SBF (Sam Bankman-Fried) and his FTX exchange get sorted out by the judicial system and the court of public opinion, one thing most can agree on is that they never saw this coming.
This opaque area within the crypto ecosystem could use some clarification. While the technology surrounding digital assets creates transparency—with its decentralized, secure and immutable ledgers—the surrounding ecosystem is not always transparent.
Exchanges potentially lack transparency. There are now hundreds of exchanges that trade 24/7 globally, and not all operate at the same standard; i.e. technology, governance, etc. As the FTX collapse unfolded, S&P Dow Jones Indices’ cryptocurrency price provider Lukka, quickly removed both FTX.com and FTX.US from its list of eligible exchanges.
Crypto exchanges can be divided into two categories—centralized and decentralized.
FTX, Binance and Coinbase are all examples of centralized exchanges (part of centralized finance or CeFi). Centralized exchanges (CEXes) are typically controlled by a single entity and operate using a central order book—the trades go through an intermediary; that is, the exchange.
Decentralized exchanges (DEXes), such as UniSwap or Aave, by contrast, have no intermediary—instead, they use smart contracts (pieces of software code) and an automated market maker (AMM) to execute transactions. Often, a DEX is set up as a decentralized autonomous organization (DAO), and decisions are made using governance tokens.
This brings us to the tokens associated with various exchanges. FTX created FTT1, a token that provided its holder a discount on FTX trading fees. FTT also could be staked (locked up) for additional rewards such as lower fees and higher rebates or used as collateral for derivatives or margin positions on FTX. Similarly, Binance exchange created BNB,2 a token that allowed discounts, payments and more on the BNB Chain ecosystem. (Coinbase is a publicly traded company that offers USD Coin, a stablecoin.)
By contrast, UNI3 and AAVE4 tokens govern their respective DEXes via on-chain governance. These token holders can propose and vote on protocol upgrades that allow it to be community led and minimize the need for trust.
All the above represent different types of exchanges and tokens, as well as different risks and values. However, they provide little transparency.
And that brings us to the role of indices. Indices bring transparency by measuring the performance of a market. Indices also provide multiple perspectives to track and potentially access a market.
The S&P Cryptocurrency Indices are no different. These indices reflect diversification, a methodology that screens index constituents on various levels, as well as an independent Index Committee, which has discretion over index decisions involving regulatory, structural or legal issues.
FTT, BNB, UNI and AAVE are all constituents of the 50-coin S&P Cryptocurrency LargeCap Index,5 though only BNB is greater than 1% of its makeup as of publication date. The FTX incident shines a light not only on the benefits of diversification, but also on the relative transparency of decentralized finance.
1 https://help.ftx.com/hc/en-us/articles/360027645972-FTX-Token-FTT-FAQ
2 https://www.binance.com/en/bnb
3 https://uniswap.org/governance
4 https://app.aave.com/governance/
5 S&P Dow Jones Indices, as of Nov. 18, 2022.
The posts on this blog are opinions, not advice. Please read our Disclaimers.

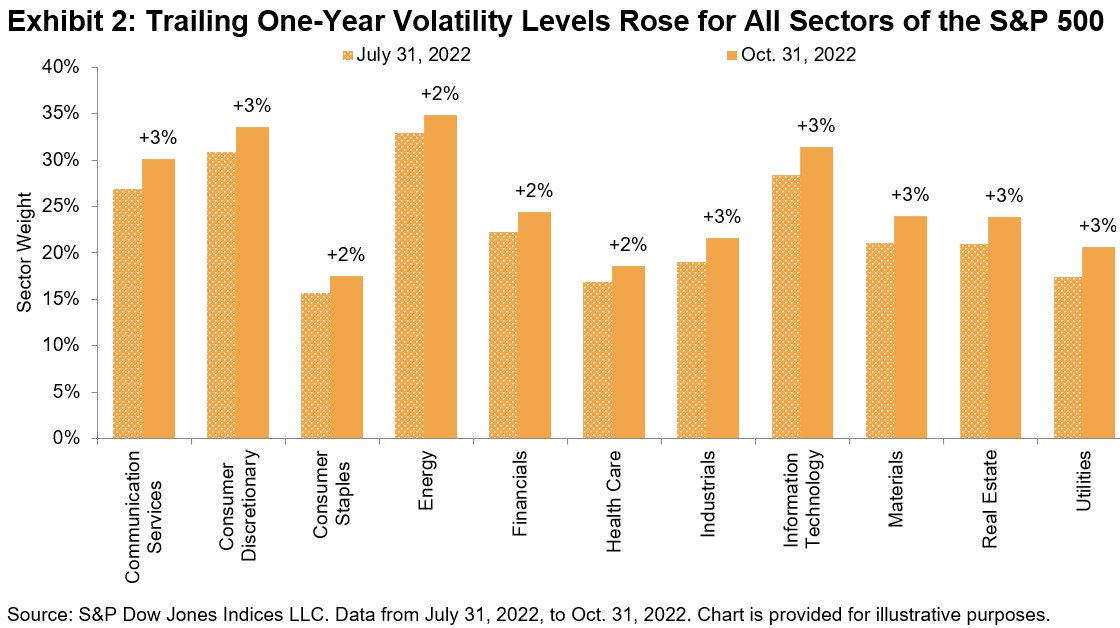
 Since August, volatility has risen for all S&P 500 sectors, with Consumer Discretionary and Energy maintaining their status as the most volatile sectors.