Get Indexology® Blog updates via email.

In This List

Paying Dividends: Measuring Rising Income against Declining Risks in the iBoxx Fixed Income Indices

Examining the Effectiveness of Defensive Strategy Indices

An Index Approach to World Cup Success

How Indexing Works for Carbon Markets

Exploring Active vs. Passive in Latin America

Paying Dividends: Measuring Rising Income against Declining Risks in the iBoxx Fixed Income Indices

Contributor Image
Brian Luke

Senior Director, Head of Commodities, Real & Digital Assets

S&P Dow Jones Indices

With the ZIRP world1 firmly in the rear view, the “income” in fixed income is back. As yields collapsed to record lows, income-starved investors sought alternative sources of income such as dividend strategies, which attracted record flows in related products throughout 2022. Now, with investment grade bond yields hitting as high as 6%, bonds are back to offering compelling income opportunities.

In addition to enhanced income, we analyze common risk signals such as credit spread, liquidity and interest rate risk to assess the current state of the bond market. Placing index attributes in a historical context, risk factors indicate stabilizing spreads and liquidity with declining interest rate risk in the broad indices. Lastly, we compare bond yields to alternative sources of income, with higher breakeven inflation yields offered in Treasury bonds compared to dividend yields in the S&P 500.

After more than a decade of investment grade corporations paying an average of 3.6%, and never more than 5%, yields on the iBoxx $ Liquid Investment Corporate Bond Index reached as high as 6.31% this summer, a nearly 4 standard deviation move from its 10-year average, before settling in the mid-5% range. While 3 standard deviation moves are rare, a move of 4 standard deviations enters “black swan” territory. Simply put, investment grade bond yields have not been this high since the aftermath of the credit crisis. Further, the spreads offered in excess of Treasuries by the iBoxx $ Liquid Investment Grade Corporate Bond Index are trading around the 10-year average of 150 bps and far from the 380 bps seen during the COVID-induced sell-off, suggesting historically high yields are not a result of degrading credit quality and the impact on rising rates is contained to the Treasury market.

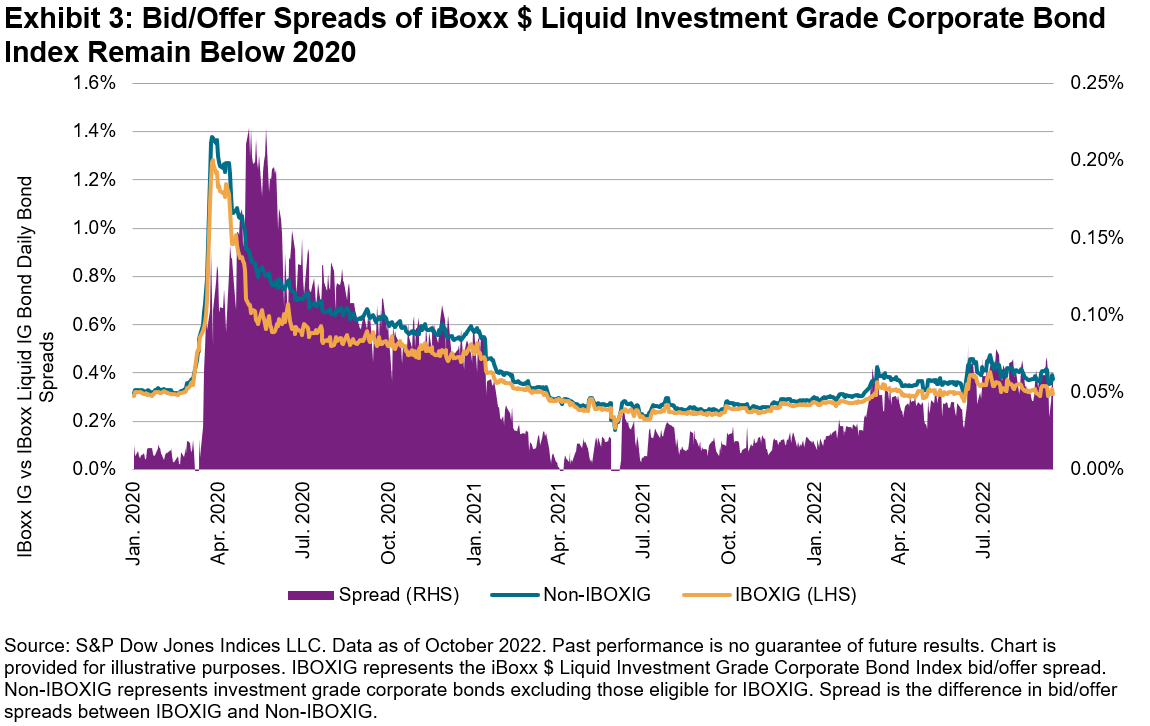
During times of stress, volatility can adversely affect liquidity, particularly in fixed income. Treasury market liquidity has declined by an average of 0.1 bps of yield this year compared to 2021. The average bid/ask yields of the iBoxx Treasury Bond Index YTD rose to an average of 0.45 bps from 0.35 bps in 2021. Conversely, the liquidity of the iBoxx $ Liquid Investment Grade Corporate Bond Index has remained relatively stable by virtue of the index methodology selecting the most traded bonds, with the average bid/offer spread well below pandemic highs, an advantage magnified during stressed markets.

While current yields appear attractive on a historical basis and relative to dividends, potential risk remains inherent in fixed income. A bond’s sensitivity to rising rates is best measured through its duration, for every given unit of duration magnifies the negative impact on prices when yields rise. Throughout the pandemic, corporate officers took advantage of low borrowing costs to raise debt and extend the duration of their loans, thereby extending overall index duration and increasing sensitivity to interest rate increases. As borrowing dropped and debt supply dropped, duration fell back to historical levels. The iBoxx $ Liquid Investment Grade Corporate Bond Index duration has shed by over a year in 2022 and is now slightly below its long-term average. With a lower duration profile, the index is less sensitive to potential rate shocks going forward.

When compared on a real (inflation-adjusted) basis, it appears bonds are offering income well in excess of those offered by many stocks. The S&P U.S. TIPS 10-Year Index represents the real yield offered by the market. Indicative dividend yields of stocks in the S&P 500® are at their lowest level in at least a decade, while the yield premium of IBOXIG yields are their highest in at least a decade.

As the Fed combats inflation to stabilize the economy, assets including fixed income and growth stocks are adversely affected. While many have flocked to dividend strategies, fixed income remains attractive as a traditional, non-alternative, source of income. Improved liquidity through proper index construction, combined with declining interest rate risk, can potentially reduce risks that plagued previous time periods. Bonds may be back, and through an index lens, are looking better and better.

1 ZIRP refers to global central banks pursuing a zero-interest rate policy (ZIRP)

The posts on this blog are opinions, not advice. Please read our Disclaimers.

Examining the Effectiveness of Defensive Strategy Indices

What does history have to say about the effectiveness of factor indices as defensive tools? S&P DJI’s Craig Lazzara explores defense beyond bonds and how defensive factors influence risk/return in different market environments.

The posts on this blog are opinions, not advice. Please read our Disclaimers.

An Index Approach to World Cup Success

Contributor Image
Sean Freer

Director, Global Equity Indices

S&P Dow Jones Indices

Football fanatics across the globe are watching closely to see which of the 32 countries that qualified for the FIFA World Cup finals in Qatar will raise the trophy in glory.

Every four years, the global spotlight scrutinizes each nation’s footballing prowess (or lack thereof). Beyond coaches, pundits and tacticians, the World Cup gives plenty of fodder for social scientists, economists and even political theorists to analyze and attempt to identify trends or patterns that may contribute to World Cup success.

If tournament success were down to population size, China and India would have surely won the cup by now. If the economy size or GDP per capita were a meaningful metric, then the U.S., Luxembourg or Singapore would surely have come close to winning the coveted cup by now. The countries topping the UN’s Human Development Index (Switzerland, Norway and Iceland) haven’t won a World Cup either. In fact, a number of these notable mentions rarely qualify for the finals.

S&P Dow Jones Indices (S&P DJI) certainly does not purport to have isolated the secret ingredient for World Cup success, but we do know indices and are keenly following competing countries that are included in the S&P Global BMI (Broad Market Index) and S&P Frontier BMI.

S&P DJI Market Classifications

The S&P Global BMI consists of 49 markets, of which 25 are classified as developed and 24 as emerging, while the S&P Frontier BMI consists of 31 additional markets. The S&P Global BMI comprises over 14,000 companies and covers all publicly listed equities with float-adjusted market values above USD 100 million that meet minimum liquidity criteria. The S&P Frontier BMI is designed to measure the performance of relatively smaller and less liquid markets.

Of the 32 countries that have qualified for the 2022 World Cup finals, 20 are included in the S&P Global BMI, covering 87.7% of the index’s market capitalization; 15 of these are considered developed, while the other 5 are emerging. Seven other competing countries are represented within the S&P Frontier BMI, covering just over a third of the index’s market capitalization, while the remaining five qualifiers do not currently meet frontier market criteria.

Developed Markets Have Better FIFA Rankings

Looking at the average FIFA ranking of each segment, the developed cohort has the lowest at 15.8, followed by the countries not classified in S&P DJI’s global equity index series at 25.8. Despite having the top-ranked nation (Brazil), the emerging cohort’s average rank is 28.2, which is higher than the frontier cohort at 27.1.

Developed Markets Overrepresented at the World Cup Finals

FIFA membership consists of over 200 nations and associations, and only 25 of those are classified as developed markets by S&P DJI. However, these nations1 represent over 40% of the countries (15 of 32) that qualified for the 2022 finals and over 60% of the teams that progressed to the round of 16.

Since the S&P Global BMI launched in 1989, there have been eight World Cup finals, two have been won by an emerging market—Brazil—and the other six by countries classified as developed markets—Germany, France, Italy and Spain.

While Brazil is the favorite to be in the World Cup Final on Dec. 18, 2022, form aside, it seems that countries from the developed markets cohort will have the highest likelihood of World Cup success. While the frontier cohort has bucked the trend outperforming emerging.

Notable Outperformers and Underperformers

Given each country’s stature in the S&P Global BMI by composition weight and number of companies, Canada, Germany and Denmark would be seen as underperformers in terms of global market stature and footballing prowess by not progressing beyond the group stage at this year’s World Cup.

While Argentina, Brazil and Croatia have outperformed their market stature, they are highly placed in their FIFA rankings—so this isn’t unexpected. Surprising outperformers would be Morocco, Ghana and Senegal based on their limited investable market stature.

S&P Dow Jones Indices Market Classification Methodology can be found here: https://www.spglobal.com/spdji/en/documents/index-policies/methodology-country-classification.pdf.

1 The U.K. is classified as one developed market but represented in multiples associations within FIFA—England, Northern Ireland, Gibraltar, Scotland and Wales.

The posts on this blog are opinions, not advice. Please read our Disclaimers.

How Indexing Works for Carbon Markets

How are innovative indices tracking compliance and voluntary carbon futures markets bringing greater transparency to the energy transition? S&P DJI’s Jim Wiederhold and KraneShares’ Luke Oliver discuss how first-to-market benchmarks are democratizing access to global carbon markets.

The posts on this blog are opinions, not advice. Please read our Disclaimers.

Exploring Active vs. Passive in Latin America

How do active managers in Latin America stack up to their benchmarks? Discover the key takeaways from the latest SPIVA Latin America Scorecard with S&P DJI’s Tim Edwards and Ericka Alcántara.

The posts on this blog are opinions, not advice. Please read our Disclaimers.