The S&P 500 lost 9.2% in its second worst December on record – only behind December 1931 when the index lost 14.5%. However, the widespread losses across sectors, styles and sizes in the broad U.S. equity market was remarkable with every major segment down in December. Only 9 times in history has every segment of the U.S. equity market lost in a month (with all sector data starting in 1995 and style data in 1997.) Those months were Aug. 2015, Sep. 2011, May and Jun. 2010, Jan. and Feb. 2009, Oct. 2008, and Jul. and Sep, 2002.
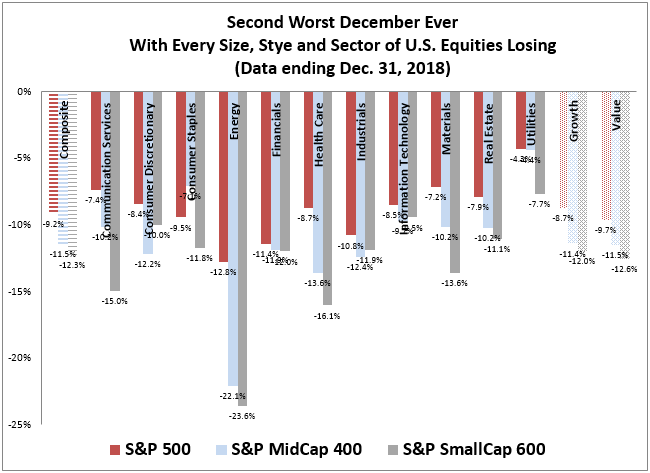
Not only was every segment of U.S. equities negative in December but 33 of 42 segments had their worst December ever, For the 9 other segments, 7 recorded their 2nd worst Decembers and 2 had their 3rd worst Decembers. Despite the December records, none of the 42 segments of the market posted their worst month ever, but the S&P MidCap 400 lost 11.5%, recording its 4th worst month ever, with the S&P 400 Health Care down 13.6%, S&P 500 Energy -12.8%, S&P 600 Consumer Staples -11.8% and S&P 600 Energy -23.6%, all recording their 3rd worst months ever.
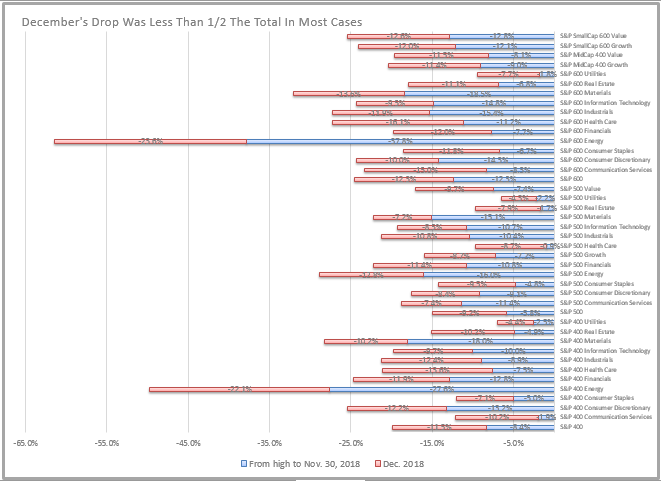
As bad as December was, it was only partly responsible for the drawdowns experienced this year. In fact, in most segments, December’s loss didn’t even account for half the total bloodshed. Only 12 of 42 segments lost more than half their total drawdown in December: S&P 600 Utilities 63%, S&P 500 Real Estate 62%, S&P 400 Communication Services 62%, S&P 400 Real Estate 57%, S&P 600 Real Estate 57%, S&P 500 Health Care 56%, S&P 600 Communication Services 55%, S&P 600 Consumer Staples 55%, S&P 500 Consumer Staples 55%, S&P 400 Health Care 53%, S&P 600 Health Care 53%, and S&P 600 Financials 52%.
Although health care and utilities declined in December for more than half their total drawdowns, they still held up relatively well for the year. Overall, health care was the only sector with big enough early gains, especially in small caps to survive the year in positive territory. The small caps outperforming large caps in health care can be due to deal making, increased expectations for acquisition of smaller companies, stronger innovation from smaller companies and that smaller companies may be more immune to concerns of regulatory pressures in healthcare.
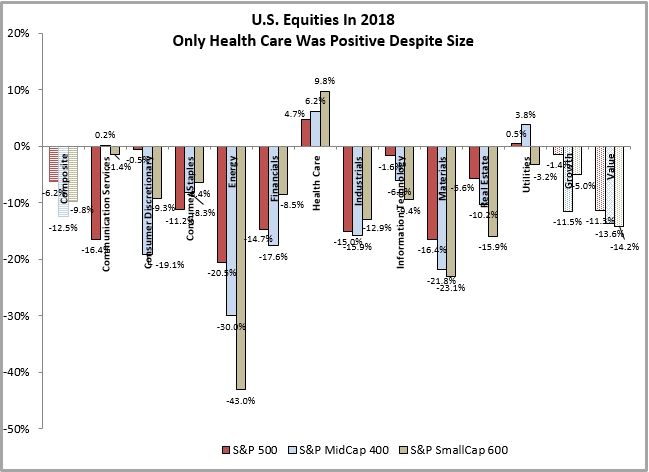
That said, the S&P SmallCap 600 Health Care index still posted its worst quarter ever, losing 23.1%, due to the slowing growth of health care spending. The S&P SmallCap 600 Industrials also logged its worst quarter ever, losing 23.5%, mainly due to a slowing economy and trade tensions. While the S&P 500 Energy had its worst 4th quarter, losing 24.4%, it was not enough to push it into its worst year, but still only lost about half of the smaller companies in the sector. If oil prices rise, and inflation picks up, small caps may get the benefit of the uptick since they are less hedged than the bigger energy companies.
What’s next for equities is impossible to know for sure, especially when there has only once been a December this bad. While the year ended down 6.2% for the S&P 500, its worst in a decade, there were 22 years prior with worse returns. In the Januaries following those 22 years, only 7 were negative, and the average return was 7.1%. In the 22 years following the years worse than 2018, 9 were negative with an average of 1.0%, and of the 7 negative Januaries, 4 of those years ended negative in 1932, 1941, 1974 and 2002. On average in all Januaries, small caps have lost 48 basis points while large caps gain 8 basis points and mid caps win gaining 39 basis points, and historically continue to win through the first quarter.
Though the market is hard to time, positioning for the rebound matters, especially by size and sector. Mid-caps may do well in these first bull-market days since they are generally not as risky as smaller companies, yet have solid infrastructure but are nimble enough to take advantage of opportunities, especially overseas if the dollar drops. Regardless of size, the financial and real estate sectors have done best on average in the first days of a new bull. Every size of these sectors develop into a bull market in the first 20 days on average after S&P 500 bottoms with large- and mid-cap financials returning nearly 28%. Even in just the first 3 days, the average returns of these segments were between 11.3% and 15.4%.
Is this time the same or different? Most of the time the markets come in cycles but there are some current issues to be focusing on now. Despite decent consumer spending and manageable debt levels, low unemployment and wage growth and a growing economy – even if slowing, there are broader systematic risks impacting the world like slowing Chinese and European growth, trade tensions, Brexit, slowing housing and rising interest rates,
The posts on this blog are opinions, not advice. Please read our Disclaimers.