S&P Dow Jones Indices recently launched the S&P Japan 500 Equal Weight Index, an equal-weight version of the S&P Japan 500. Over the 15-year period ending in February 2018, encompassing the latter part of Japan’s so-called “lost decades” of stagnant equity returns, the equal-weight index would have outperformed the cap-weighted Japanese equity benchmark by a stonking 7.41%, annualized. This compares quite favorably with the 2.2% and 2.1% outperformance of equal-weight indices in Europe and the U.S., respectively (see our recent paper). So what explains incremental returns of this magnitude?
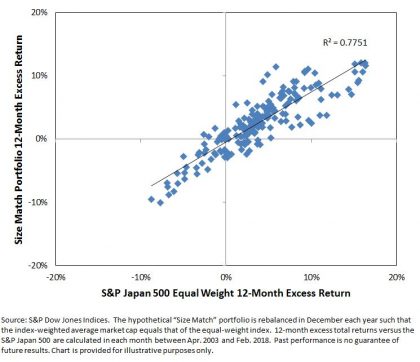
Exposure to smaller stocks is important for equal-weight. To examine the impact of size we construct a hypothetical “Size Match” portfolio using a combination of the S&P/TOPIX 150 and the S&P Japan SmallCap 250 Index that matches the equal-weight index’s average exposure to larger and smaller companies. (The exhibits in this post are constructed following the process outlined in the paper linked above.) Exhibit 1 shows how the smaller size bias could explain 76% of the variation in the relative returns of the S&P Japan 500 Equal Weight Index.
Exhibit 1: Smaller size explained a majority of the variation in equal-weight excess returns.
Anti-Momentum also helped, particularly in Japan. Equal-weight indices have an intuitive relationship with (anti-) momentum effects. Specifically, equal-weight indices rebalance by selling those stocks that have outperformed the average, and by purchasing those that have underperformed the average. This is opposite of what a trend-following strategy seeks to do. Momentum, generally speaking, is considered to be a rewarded strategy in equities. However, quite famously, it isn’t so-well rewarded in Japan. So what role did momentum play in the relative performance shown in Exhibit 1?
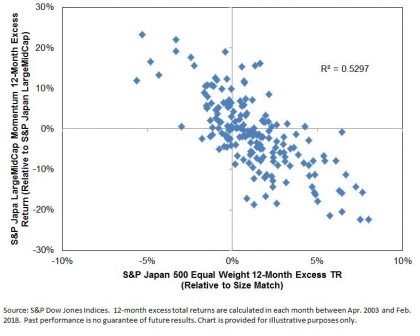
Exhibit 2 shows the negative relationship between the returns to equal-weight not explained by smaller size exposure and the relative performance of the S&P Momentum Japan LargeMidCap Index to the S&P Japan LargeMidCap Index. According to the relationship evidenced in Exhibit 2, 53% of the excess returns not accounted for by size effects can be attributed to anti-momentum effects. (Again, we present only the results of a standardized attribution process described more fully in the paper).
Exhibit 2: Anti-momentum effects in Japan
Through the perspectives of its size and momentum exposures, around 89% of the outperformance of equal-weight in Japan over the past 15 years might accordingly be “explained”, or at least understood through the familiar concepts of size and rebalancing effects.
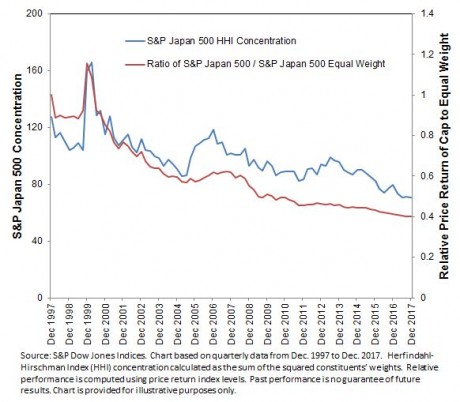
And what of the future? Of course, there is no way of telling if the S&P Japan 500 Equal Weight Index will outperform its cap-weighted parent over the next 15 years. However, at least one additional perspective may be useful: if smaller stocks outperform larger stocks, the overall concentration of market benchmarks logically decreases. Exhibit 3 evidences this relationship as applied to the S&P Japan 500. Notably, the Herfindahl-Hirschman Index concentration of the S&P Japan 500 has declined considerably over the period we are examining – from a peak of 160 down to a level of 70 at the end of December 2017. The hypothetical minimum concentration that a 500-stock portfolio can display is 20 – achieved when every stock has the same weight – which suggests that a similar “boost” from declines in concentration levels may not be repeated.
Whatever the future brings, market participants may be well-served to consider multiple perspectives on equal-weight indices when trying to explain their characteristics and potential applications.
Exhibit 3: S&P Japan 500 concentration and the relative performance of Equal Weight