


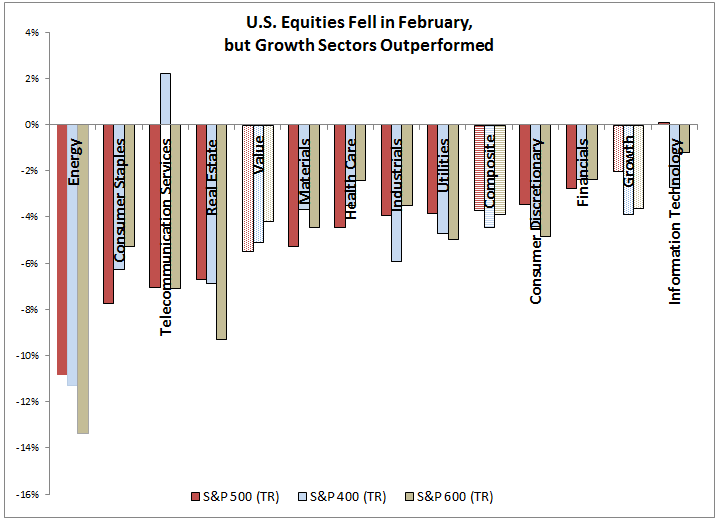
February ended the longest historical monthly winning streak of 15 months for the S&P 500 (TR) that lost 3.7%. On a total return basis for the month, 10 of 11 sectors lost, which has only happened in 12 of 342 months or 3.5% of the time (all 11 lost together in 13 months for a total of 25 or 7.3% of months where 10 or 11 lost together.) Energy lost 10.8%, the most of any sector. It was the 10th worst month on record for energy since Oct. 1989, and its worst month since Sep. 2011. Rising inventories and concerns on Chinese demand put pressure on the sector, especially on the smaller companies that may be less hedged. Only information technology was barely positive, up 0.1%.
The biggest story in February besides the correction itself may have been volatility that almost tripled. The annualized 30-day volatility rose from 8.1% on Jan. 31, 2018 to 22.5% on Feb. 28, 2018, and is the highest since Feb. 19, 2016. To put it in perspective, the average going back to Feb. 12, 1988 is 15.2% and the volatility has only been greater than 22.5%, the current level, in 12.5% of times.

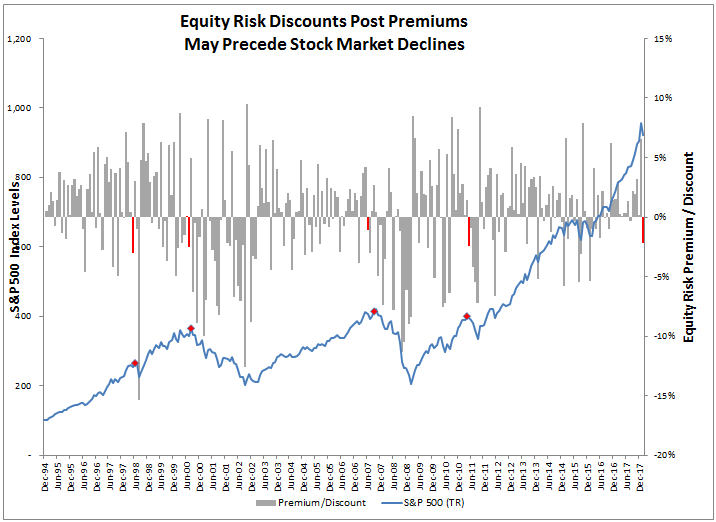
While volatility has increased in many down markets, it may not be a bad thing and can provide some trading opportunities. However, at this point, there may be some warning signs, particularly from the S&P 500 Bond Index, the corporate bonds of the companies in the S&P 500. These bonds say a lot about the financial health of the companies in the S&P 500 since the performance (or conversely yields) of the bonds may be dependent on the credit rating and ability of these firms to make payments. Given rising interest rates generally put pressure on the bonds, and the topic has been concerning for some time now, the S&P 500 Bond Index has already been negative in 4 of the last 6 months. Perhaps even more importantly, the risk premium as measured by the monthly return of the S&P 500 TR minus the S&P 500 Bond Index was negative (in other words was a discount) back in August 2017 that showed pessimism in the market, despite a positive stock market return. This is since when bonds outperform stocks it says investors may prefer to hide in the downside protection of the bonds rather than to participate in the upside of the stocks. Additionally the record high optimism observed in Jan. 2018 could have been taken as a warning signal given the history of stock market performance after discounts follow high premiums.
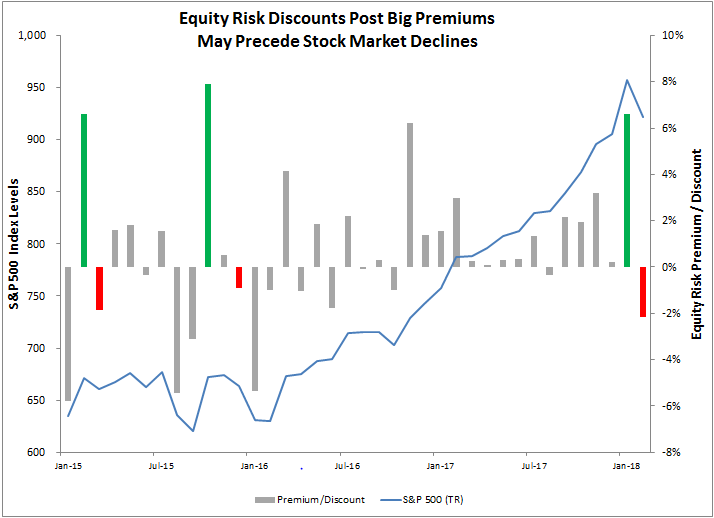
And for a closer view of the past 3 years:
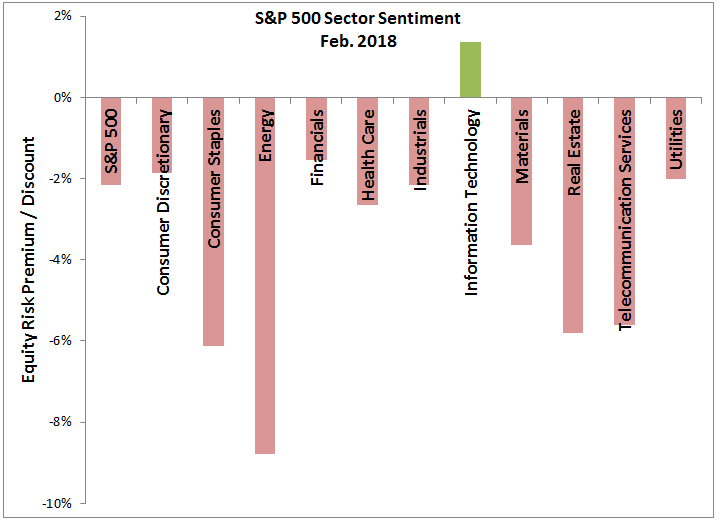
Does that mean one might want to completely sell stocks? Probably not, especially if one believes in long-term growth of the economy. However, the risk premiums by sector can be one place to look for where to overweight or underweight in addition to other macroeconomic factors. Right now every sector but information technology is measuring pessimistic, which is the broadest pessimism seen since Aug. 2015 when all sectors showed a discount. Consumer staples, energy and real estate are showing notably big discounts that while bearish, are not necessarily bearish on the economy yet. It is clear that the glass is half empty in energy from the inventory and Chinese demand concerns, real estate is one of the worst impacted sectors from rising rates, and consumer staples is basically a defensive play so when there is expected growth, the market may lean towards consumer discretionary. Financials and information technology are the other two growth sectors to watch before worrying too much.
Lastly, looking at GDP growth, the dollar, interest rates and inflation, it seems that small-caps and mid-caps are better positioned than large caps now and that energy, materials, information technology and financials are better positioned than real estate, utilities and telecom.
The posts on this blog are opinions, not advice. Please read our Disclaimers.


 Chart is provided for illustrative purposes. Assumes that the first dollar of income is received at the end of the first year of retirement. Present value calculation assumes a hypothetical discount rate
