


What are the three main reasons it’s hard for most active managers to beat their benchmarks? Explore findings from the SPIVA and Persistence Scorecards with S&P DJI’s Craig Lazzara including an allegorical look at what might happen if Craig challenged Michael Jordan to a free-throw shooting contest.
The posts on this blog are opinions, not advice. Please read our Disclaimers.SPIVA and the Challenges of Active Outperformance
Breakfast – The Most Important Meal of the Day
Results from the Recent S&P 500 Net Zero 2050 Paris-Aligned Sustainability Screened Index Rebalance (March 2023)
Unwisely Concentrated
An Israeli Home with a U.S. Twist
SPIVA and the Challenges of Active Outperformance
Breakfast – The Most Important Meal of the Day

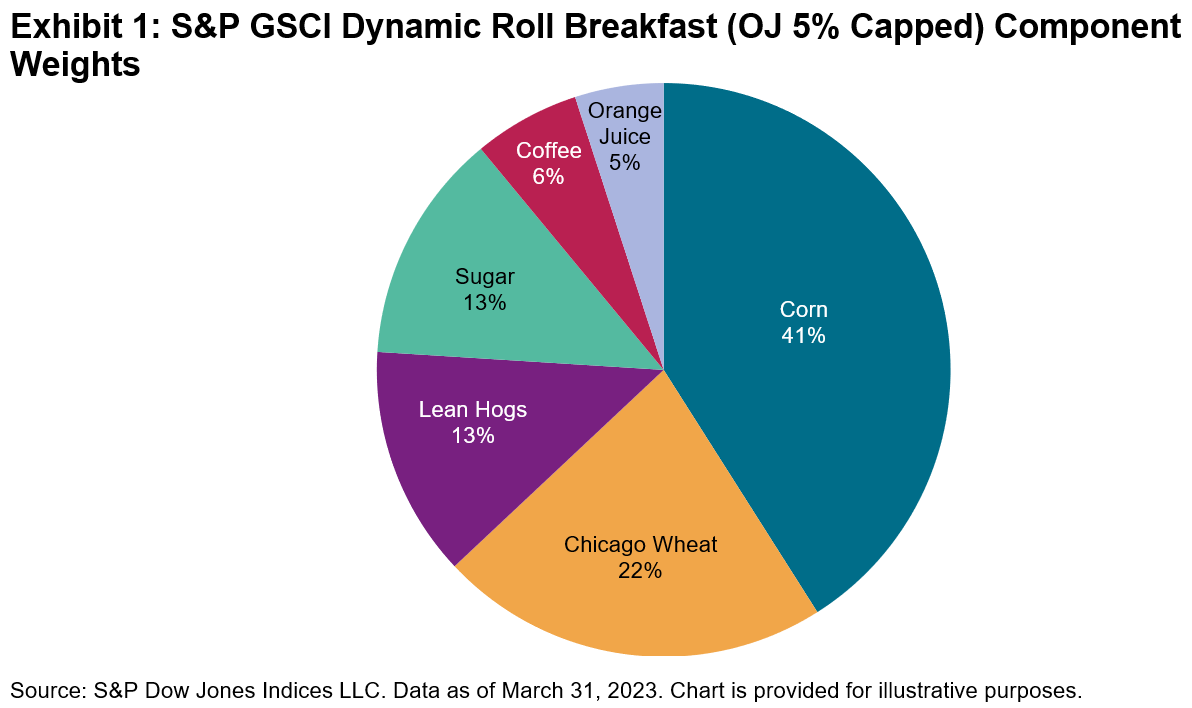
The first quarter of 2023 was a slow start to the year for commodities in general. The S&P GSCI Dynamic Roll Breakfast (OJ 5% Capped) also had a slow start, down 3.1%, after a solid 2022 performance of 14.12%. Maybe a higher weight to coffee would give the index the caffeine kick needed to boost performance—the S&P GSCI Coffee was up 5.8% for Q1 2023, as rising temperatures in the tropics lead to lower crop yields in the coffee-growing regions around the world. However, we would not be able to change the weightings of our breakfast index on a whim because it is based on world production of each of the six commodities making up the index.
The world’s food supply may continue to experience perilous geopolitical-based events like the Russia-Ukraine conflict, directly affecting nations who are some of the largest exporters of key grains, leading to price spikes like was seen last year with wheat. Other key agriculture-exporting regions are experiencing rising political instability, especially in some South American and North African countries.
While supply chain issues have mostly been resolved, the costs of production and transport will likely rise over time as every industry encounters scrutiny over carbon emissions. Major commodity producers regularly announce new plans to lower their carbon footprint, which will come at a higher cost but is needed to help combat climate change.
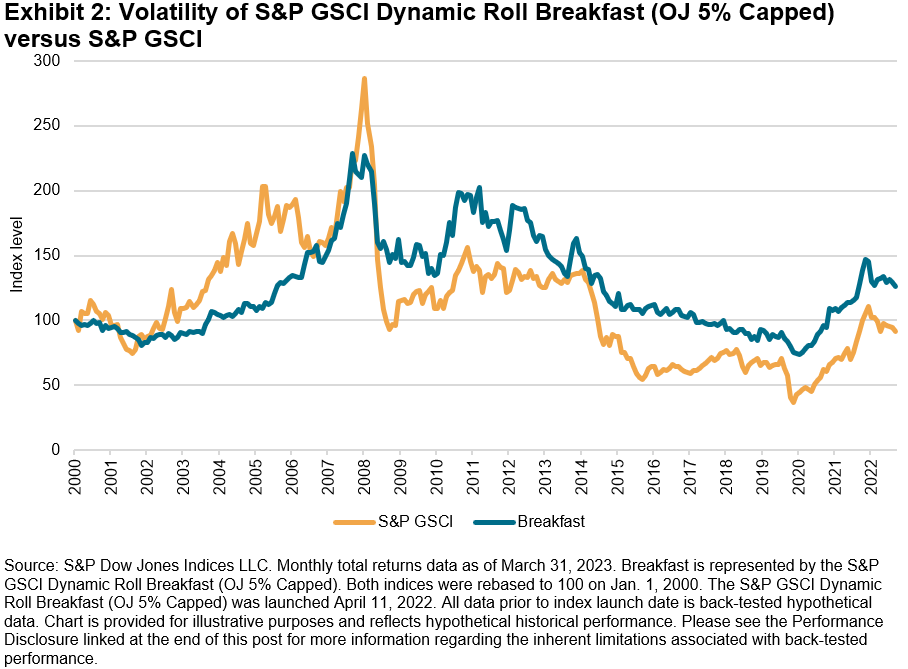
Compared to the headline benchmark S&P GSCI, breakfast commodities performed in a much less volatile manner over the last 20 years, as can be seen in Exhibit 2. The main reason is due to the lack of more volatile energy commodities that are included in the S&P GSCI. Unless gasoline is added to your morning coffee, breakfast tended to be a much smoother start to your day over the years, although there have been periods of much higher volatility for some of the individual breakfast commodities.
The S&P GSCI Dynamic Roll Breakfast (OJ 5% Capped) provides market participants with a new thematic way to look at commodities and offers a benchmark to key themes of food security against the backdrop of a rising global population. For more information on our commodities indices, please visit our website.
The posts on this blog are opinions, not advice. Please read our Disclaimers.Results from the Recent S&P 500 Net Zero 2050 Paris-Aligned Sustainability Screened Index Rebalance (March 2023)

- Categories Sustainability
- Tags Carbon Emissions, climate, Climate Transition, decarbonization, ESG, EU Climate Transition Benchmarks, EU Paris-aligned Benchmarks, greenhouse gas, Net Zero, Paris Climate Agreement, S&P 500 Net Zero 2050 Paris-Aligned Sustainability Screened Index, S&P PACT, sustainability
Narottama Bowden,
The author would like to thank Clara Arganaraz, Index Manager of the S&P 500® Net Zero 2050 Paris-Aligned Sustainability Screened Index, for her contributions to this post.
S&P Dow Jones Indices recently completed the rebalancing of all indices that aim to meet the minimum requirements for EU Climate Transition and EU Paris-Aligned Benchmarks.1 This includes the rebalancing of the S&P 500 Net Zero 2050 Paris-Aligned Sustainability Screened Index, which is designed to measure the performance of eligible equity securities from the S&P 500, selected and weighted to be collectively compatible with a 1.5ºC global warming climate scenario at the index level, among other climate, environmental and sustainability objectives.
The index is designed to achieve a variety of ESG objectives through the use of sustainability screening in its eligibility criteria and an optimization process in constituent selection and weighting, including a reduced overall greenhouse gas (GHG; expressed in CO2 equivalents) emissions intensity compared to its underlying index (the S&P 500) by at least 50%. It also has a minimum self-decarbonization rate of GHG emissions intensity in accordance with the associated trajectory implied by the Intergovernmental Panel on Climate Change’s (IPCC) most ambitious 1.5ºC scenario, equating to at least a 7% GHG intensity reduction on average per year.
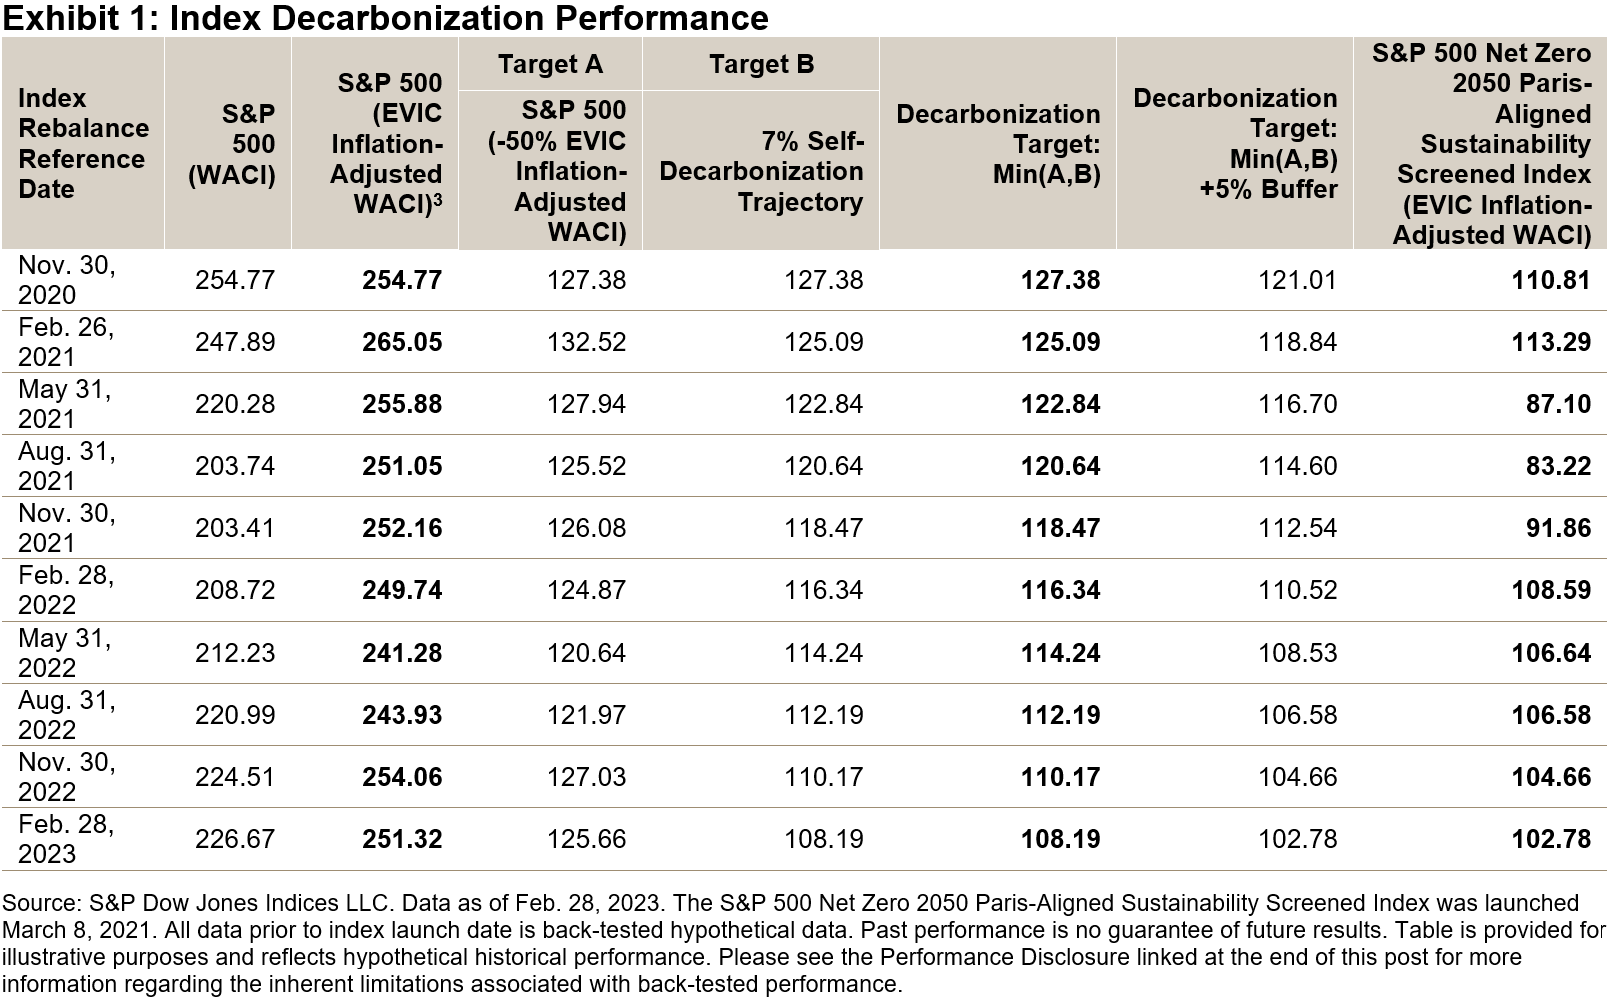
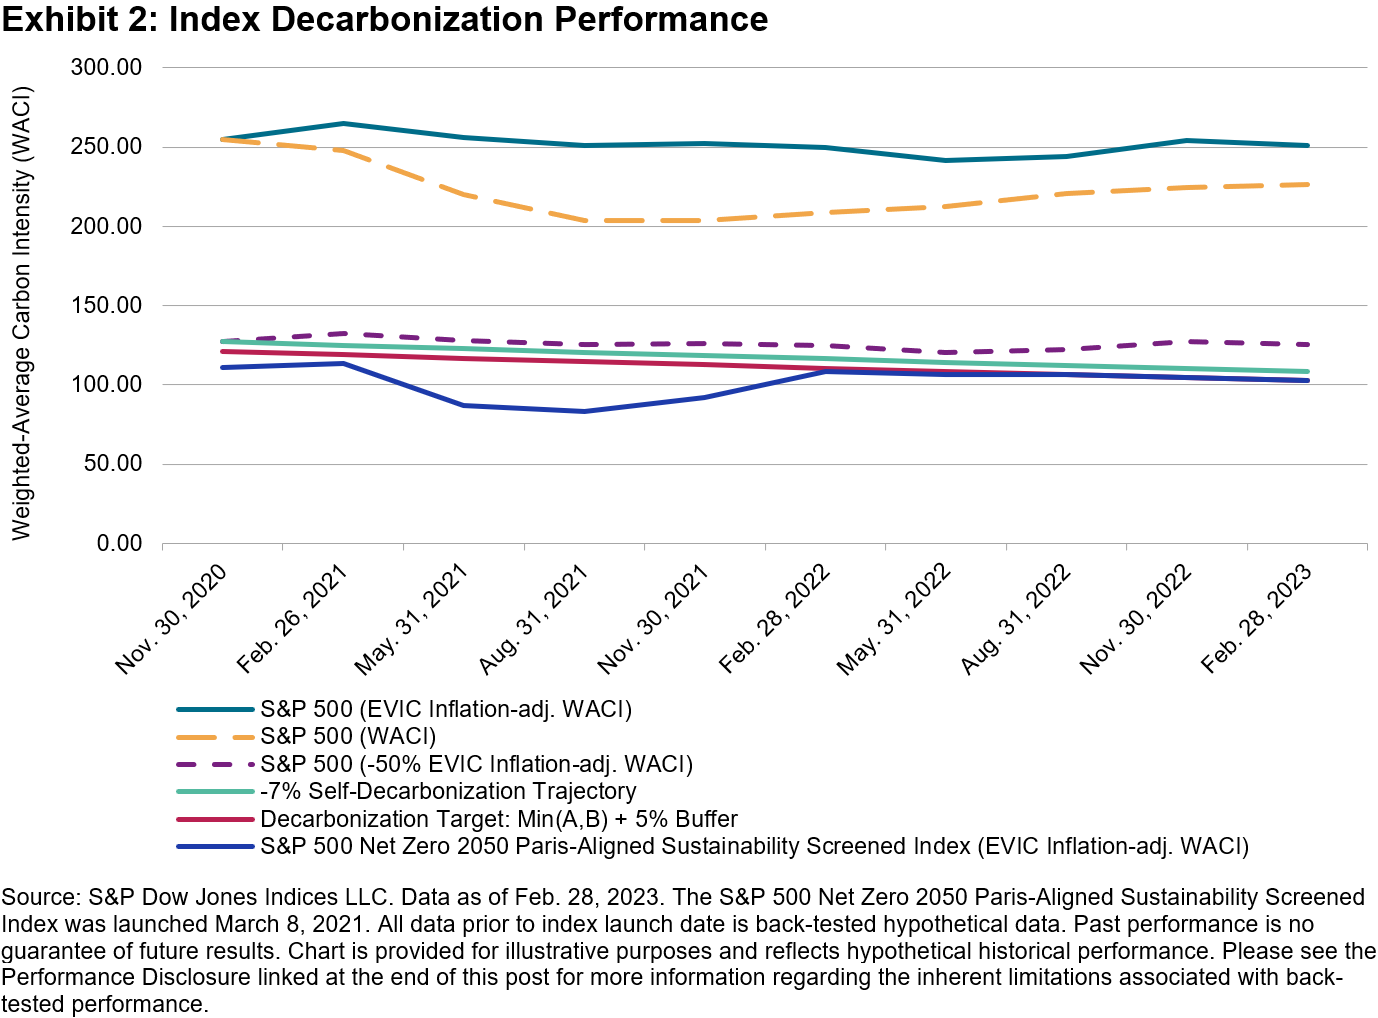
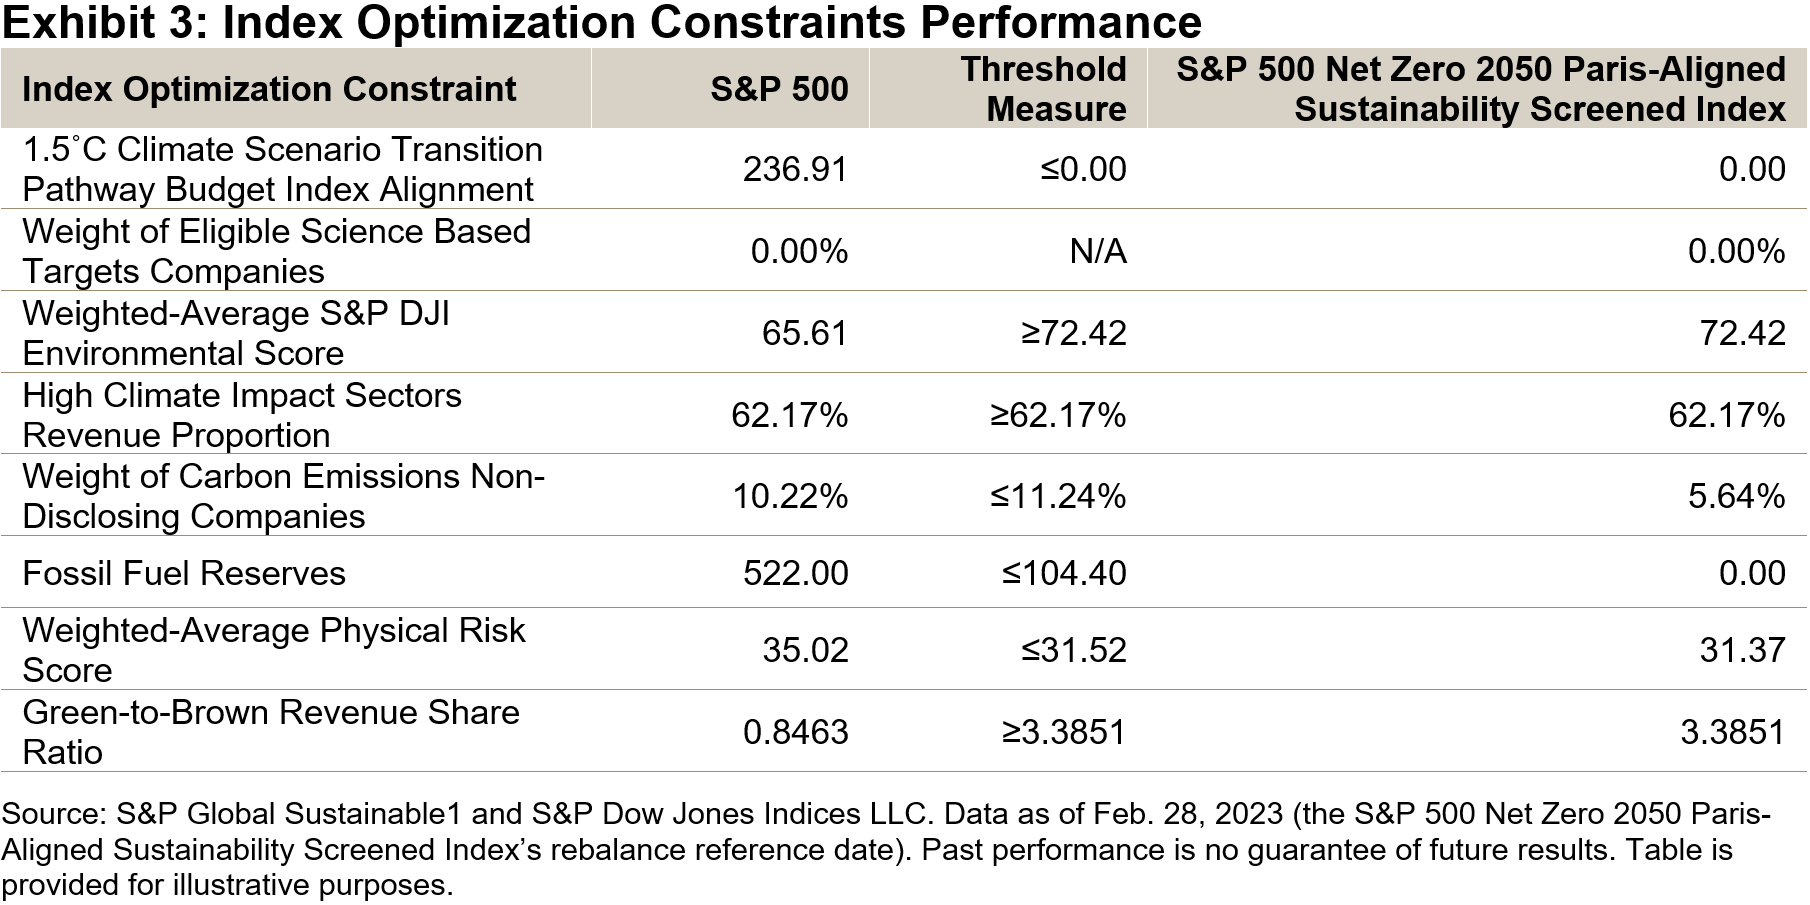
As of the index’s Feb. 28, 2023, rebalancing reference date (and all previous rebalances), the index’s enterprise value including cash (EVIC) inflation-adjusted weighted-average carbon intensity (WACI)2 achieved its required level of decarbonization—the minimum of either half the S&P 500 WACI or its 7% self-decarbonization trajectory WACI as at the rebalance reference date. The index achieved a relative decarbonization to the underlying index of 59.10% at an EVIC inflation-adjusted WACI at the required level (102.78).
The index seeks to achieve a variety of other objectives simultaneously, and once more, was able to achieve them successfully at the recent rebalance.
- The index’s weighted-average 1.5˚C Climate Transition Pathway Budget Alignment4 was zero, implying the index is 1.5˚C Climate Scenario-aligned at the index level.5
- The index’s weighted-average S&P DJI Environmental Score achieved the minimum level required at this rebalance (72.42) based on this constraint in the methodology, also exceeding the score of the underlying index (65.61).
- The index’s high climate impact sectors revenues exposure was at least as high as in the underlying index, as required by the minimum standards for EU Climate Transition Benchmarks and EU Paris-aligned Benchmarks.
- The index had a lower exposure to companies deemed to insufficiently disclose their GHG emissions, at a level well below its maximum exposure permitted by the methodology.
- The index did not have any exposure to companies with fossil fuel reserves, despite the methodology permitting a maximum of 20% of the exposure of the underlying universe.
- The index-level physical risk score (31.37) was below the required level as of the rebalance (31.52), as defined by the methodology, and it was lower than the underlying index’s score (35.02).6
- The index’s ratio of green revenues to brown revenues was four times higher than in the underlying index, as required by the methodology.
The S&P 500 Net Zero 2050 Paris-Aligned Sustainability Screened Index seeks to achieve a range of climate change, environmental and sustainability objectives, and again the index has met these ambitions.
1 Commission Delegated Regulation (EU) 2020/1818 of 17 July 2020 supplementing Regulation (EU) 2016/1011 of the European Parliament and of the Council as regards minimum standards for EU Climate Transition Benchmarks and EU Paris-aligned Benchmarks. https://eur-lex.europa.eu/legal-content/EN/TXT/PDF/?uri=CELEX:32020R1818&from=EN
2 Measures are calculated in metric tons of carbon dioxide-equivalent emissions per USD 1 million of EVIC (tCO2e/USDmn). For more information on how this metric is calculated, see “Weighted-Average Carbon Intensity (WACI)” in the Constraint-related Definitions section of the S&P 500 Net Zero 2050 Paris-Aligned Sustainability Screened Index Methodology.
3 For more information on how the WACI is adjusted for EVIC inflation, see “Inflation Adjustment” in Section 3, Part 4 of the EU Required ESG Disclosures Appendix in the S&P Paris-Aligned & Climate Transition Index Family Benchmark Statement
4 For more information on how this metric is calculated, see the Constraint-related Definitions and Optimization Constraints sections of the S&P 500 Net Zero 2050 Paris-Aligned Sustainability Screened Index Methodology, and the S&P Dow Jones Indices: ESG Metrics Reference Guide.
5 A measure at or below zero means the index is 1.5˚C Climate Scenario-aligned at the index level.
6 A lower score is associated with less physical risk exposure at the index level.
The posts on this blog are opinions, not advice. Please read our Disclaimers.
Unwisely Concentrated

Anyone familiar with our SPIVA Scorecards will recognize that most active managers fail most of the time. Anyone familiar with active managers will recognize that they can be quite creative in proposing both excuses and remedies for this historical record. One of their most persistent suggestions, in fact, is that active management simply isn’t active enough, leading some asset owners to search for more “exposure to concentrated active managers.”
This approach is misdirected for at least three reasons:
First, it assumes that the level of a manager’s optimism about a stock predicts its future performance. The argument for concentration necessarily implies both that stock selection skill exists, and that it is particularly acute at its extremes. Not only, e.g., must a manager be able to build a 50-stock portfolio that will outperform, he must also be able to identify which 10 stocks of the initial 50 are the best of the best. For concentrated portfolios to outperform, both assumptions—that skill exists, and that it is acute at the extremes—must be true simultaneously. There is no evidence that either of them is. If it exists at all, the requisite skill must be quite rare. If this were not so, active funds would not be facing a performance challenge in the first place.
Second, under reasonable assumptions, concentrating equity positions raises the probability of underperformance. One of the most consistent characteristics of global equity markets is that returns are positively skewed—when graphed, they have a long right tail, as shown in Exhibit 1. This is intrinsically logical, since a stock can only lose 100%, but has unlimited upside.
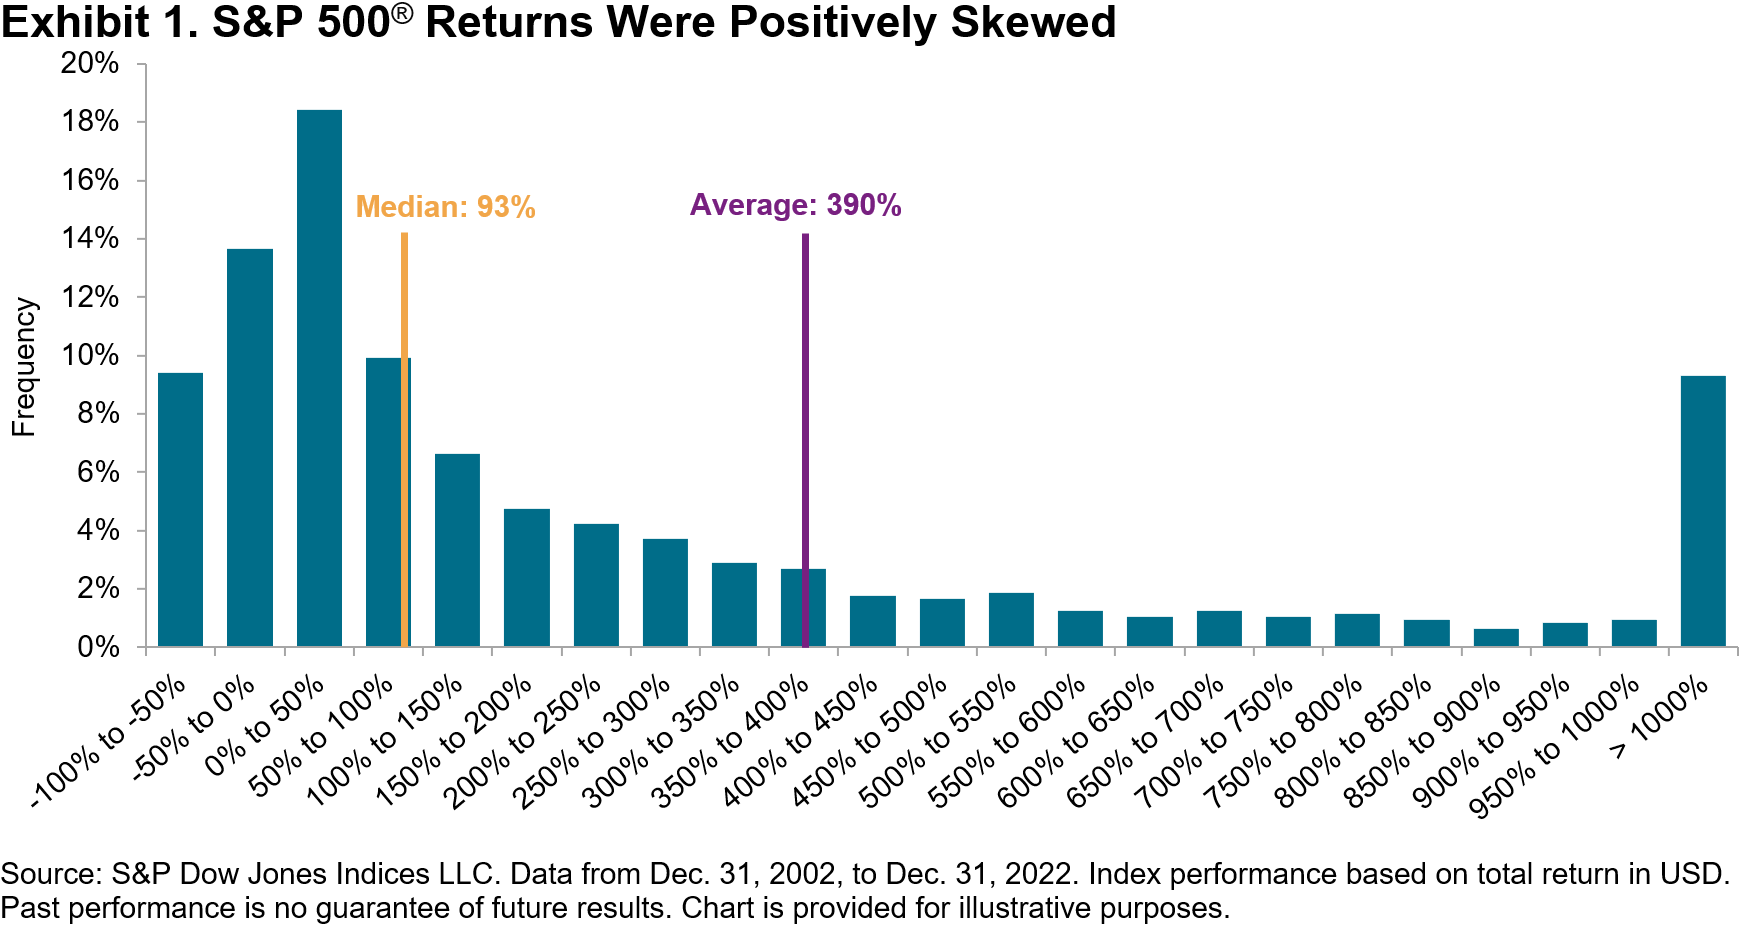
For the 20 years ending in 2022, the median return of S&P 500 members (during their index membership) was 93%, far below the average return (390%). Only 24% of the index’s constituents outperformed the average stock. In such a market, a manager’s success is dependent on his ownership of a relatively small number of strong performers. The more concentrated a portfolio is, the less likely it is to own the big winners.
Third, concentrated portfolios make it harder to distinguish between signal and noise. While some managers may be skillful, none are infallible. A manager who is skillful but not infallible will benefit from having more, rather than fewer, opportunities to display his skill. A useful analogy is to the house in a casino: on any given spin of the roulette wheel, the house has a small likelihood of winning; over thousands of spins, the house’s advantage is overwhelming.
Skillful managers sometimes underperform; unskillful managers sometimes outperform. The challenge for an asset owner is to distinguish genuine skill from good luck. The challenge for a manager with genuine skill is to demonstrate that skill to his clients. The challenge for a manager without genuine skill is to obscure his inadequacy. Concentrated portfolios make the first two tasks harder and the third easier.
The posts on this blog are opinions, not advice. Please read our Disclaimers.An Israeli Home with a U.S. Twist

Our new research paper shows that Israeli investors have a greater home bias than other nations: they have invested more heavily in domestic equities and allocated to the U.S. in lower proportions than their developed markets peers such as the U.K., Europe and Canada. With U.S. equities making up nearly 60% of the S&P Global BMI’s market capitalization, such allocations may be overlooking a sizeable portion of the global equity opportunity set. Adding some U.S. decor to a domestic Israeli equity allocation also historically provided higher return in both absolute and risk-adjusted terms, and could offer the potential for diversification.
U.S. Equities Have Outperformed Their Israeli Counterparts over Various Horizons
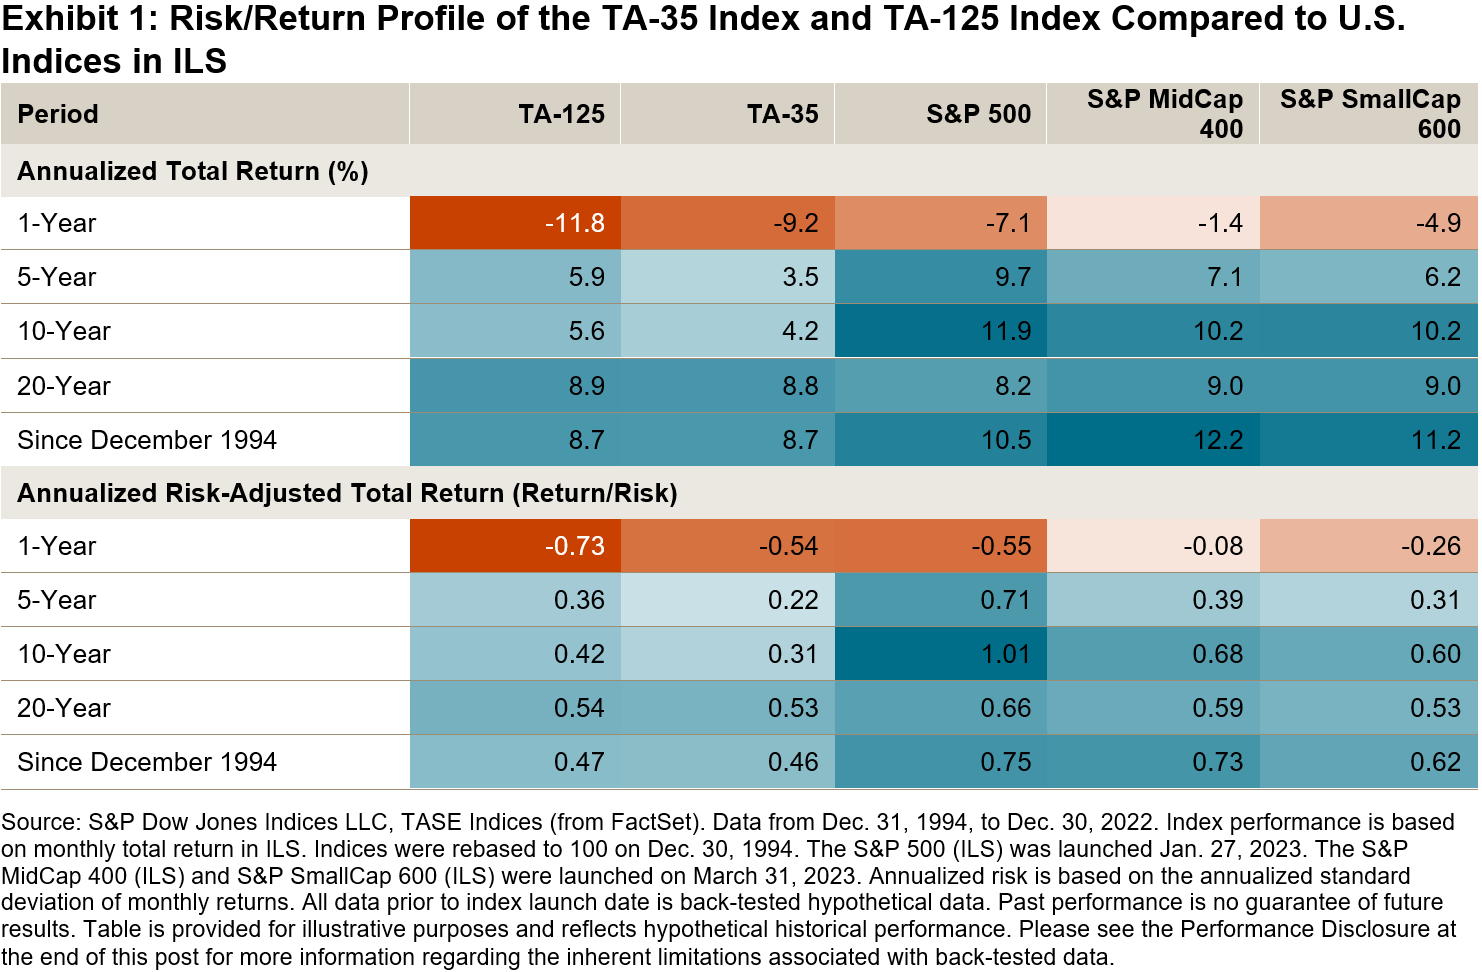
The S&P 500®, S&P MidCap 400® and S&P SmallCap 600® outperformed the Israeli equity market—as represented by the TA-125—by 15%, 11% and 9%, respectively, in Q1 2023 (all in ILS and total return terms). Exhibit 1 shows that this phenomenon is not just a recent one: U.S. equities have outperformed their Israeli counterparts over short-, medium- and long-term horizons in both absolute and risk-adjusted terms. Similar results are observed for USD-denominated versions of the indices.
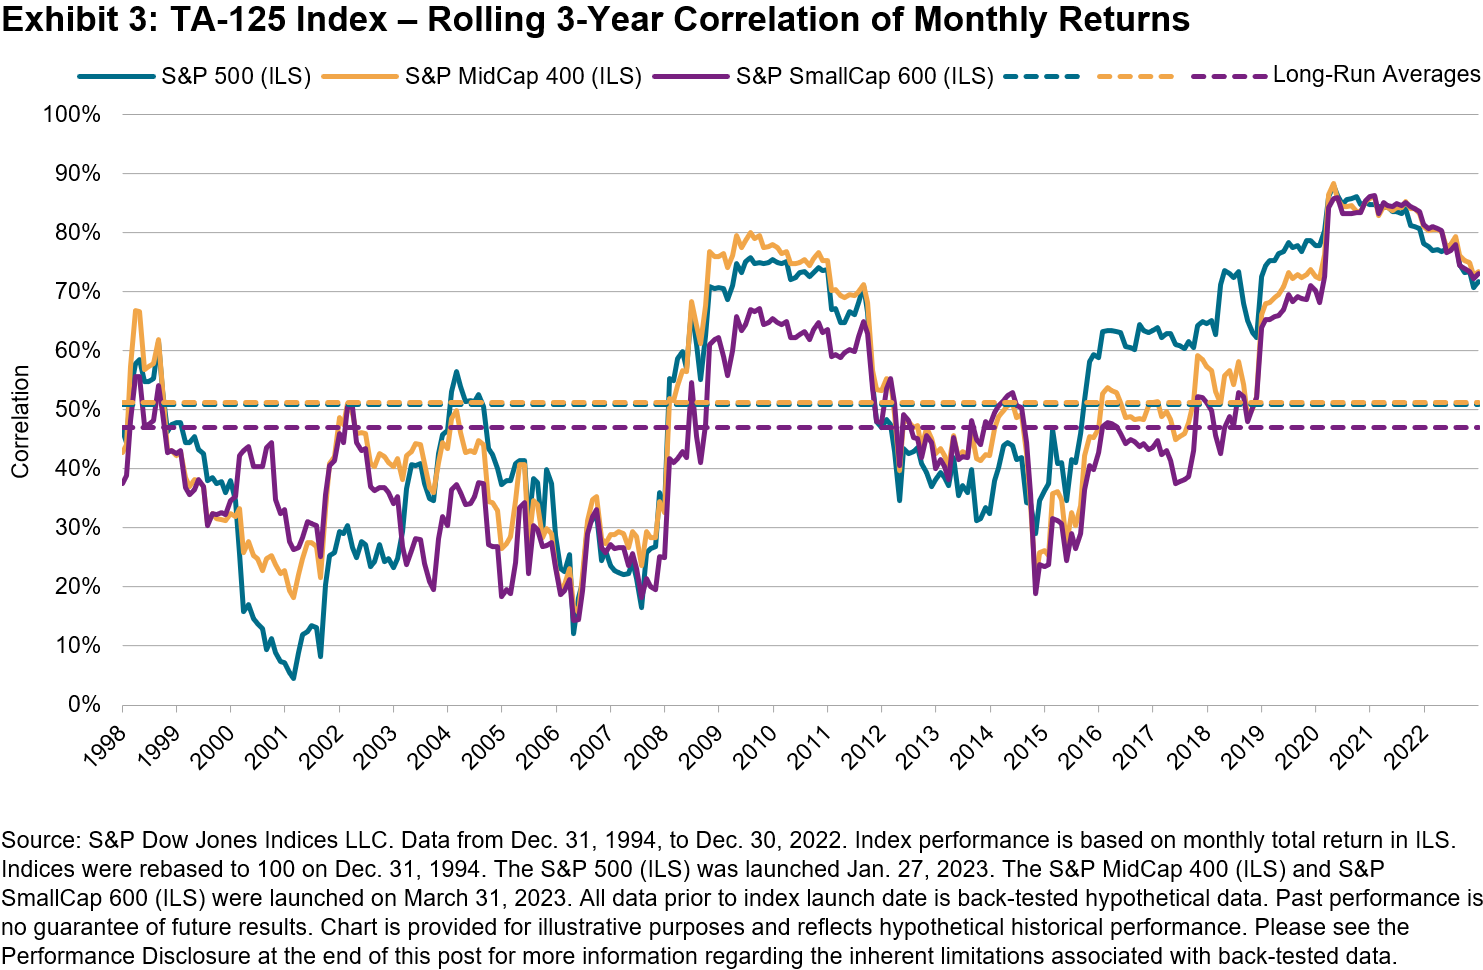
Looking at the correlation of U.S. equities with the TA-125 and blue-chip TA-35 in Exhibit 2 we can see that all of the S&P Composite 1500®’s component indices had a correlation of less than 0.5 (based on monthly returns since Dec. 31, 1994). This suggests an opportunity for U.S. equities to act as a diversifier when incorporated into Israeli equity allocations.
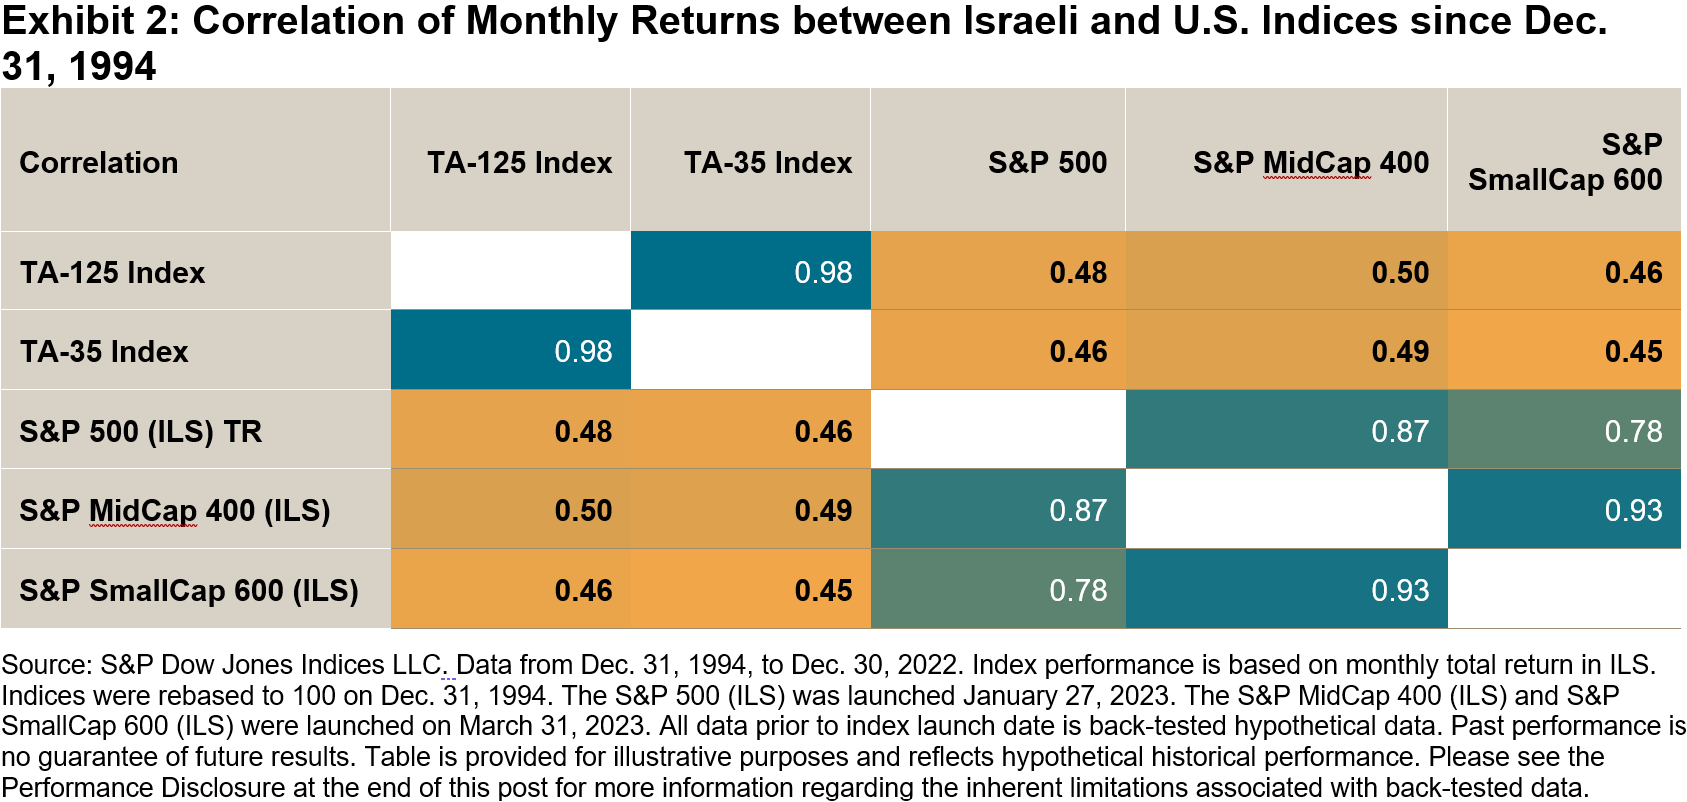
Despite recent spikes in 3-year rolling correlation, compared to correlations over the last 28 years, U.S. and Israeli equities are not perfectly correlated (equal to 1), which means there is still opportunity for diversification. In recent times, that opportunity has increased, with U.S. and Israeli equities continuing to decouple from their 2020 coronavirus correlation highs.
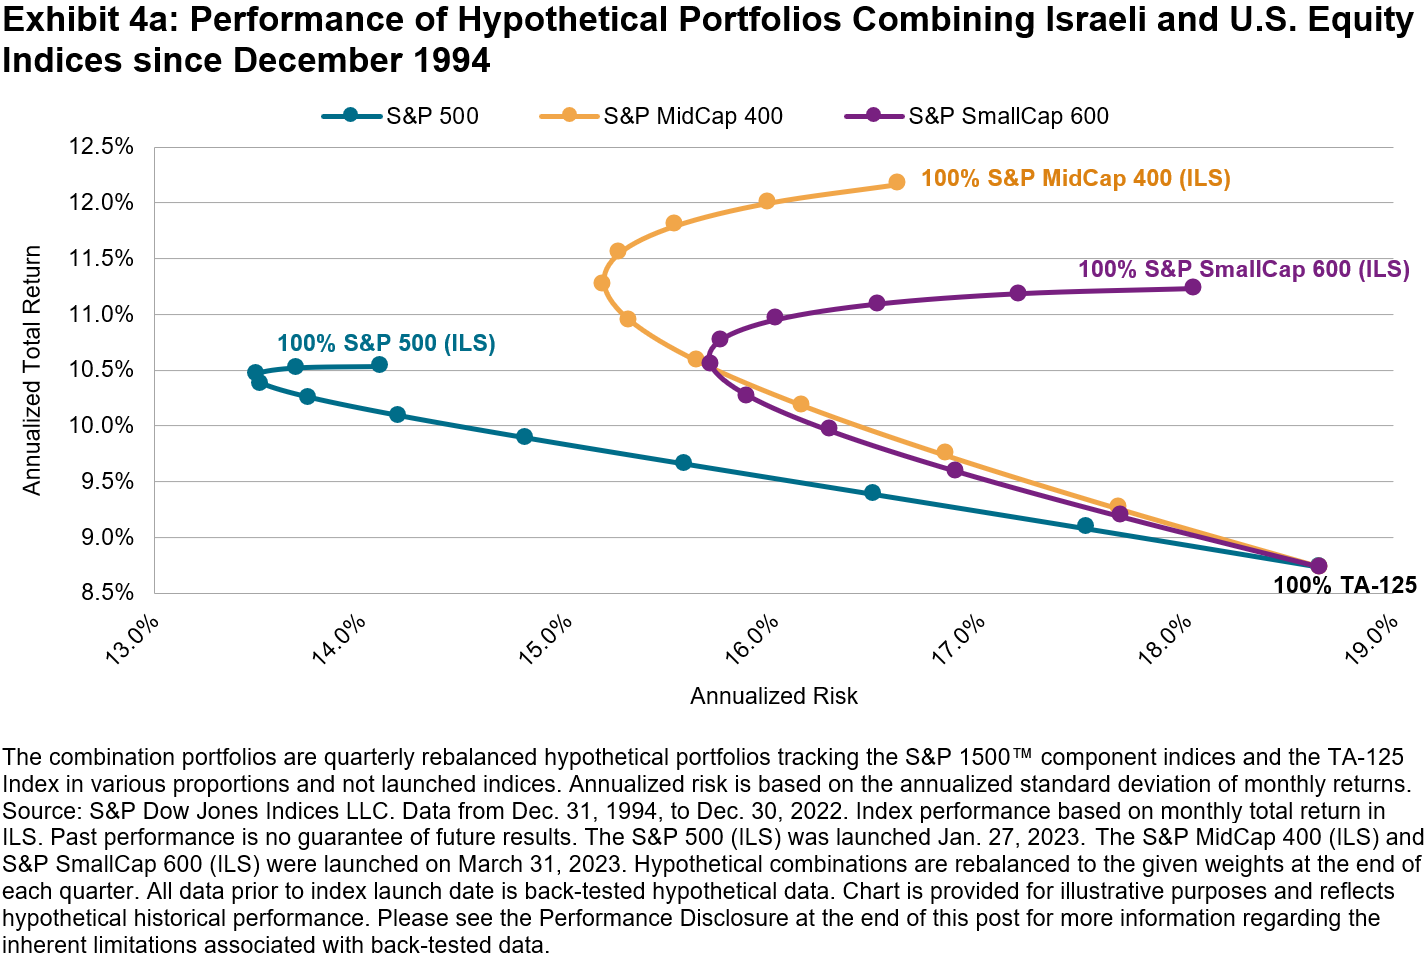
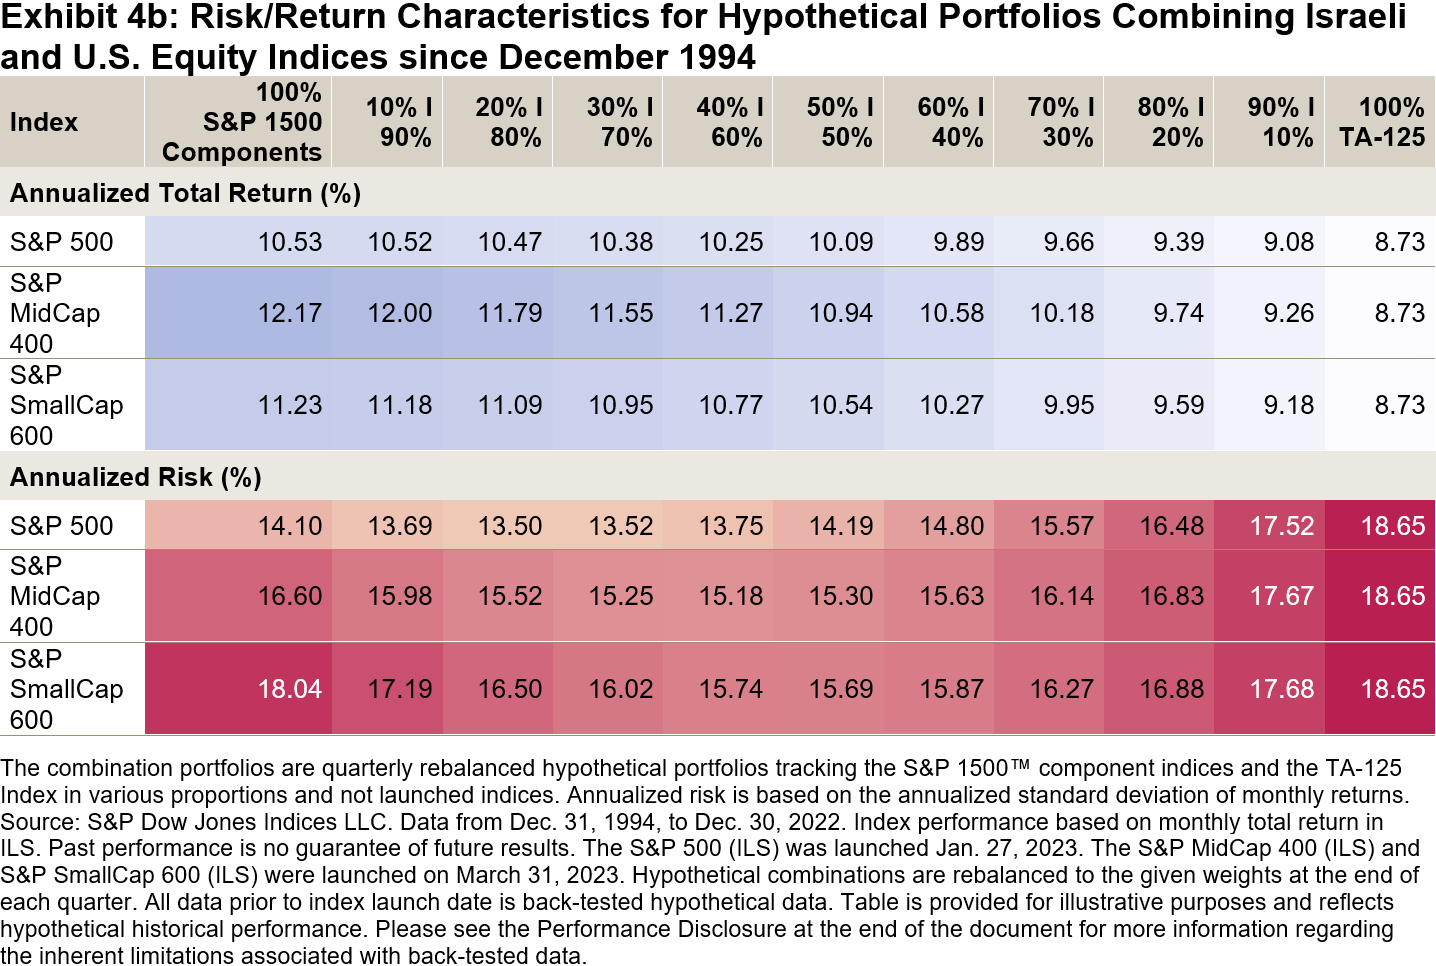
The outperformance of U.S. equities, and their lower long-run correlations with Israeli equities since December 1994, has meant that adding U.S. equities to an Israeli equity allocation could have improved returns, with lower volatility. Exhibit 4a shows the annualized return and volatility figures for various hypothetical combinations of the S&P 500, S&P MidCap 400 and S&P SmallCap 600 with the TA-125, starting with a 100% Israeli allocation and moving in 10% increments to a 100% U.S. equity allocation. Each hypothetical portfolio rebalances back to the target weights at the end of each quarter.
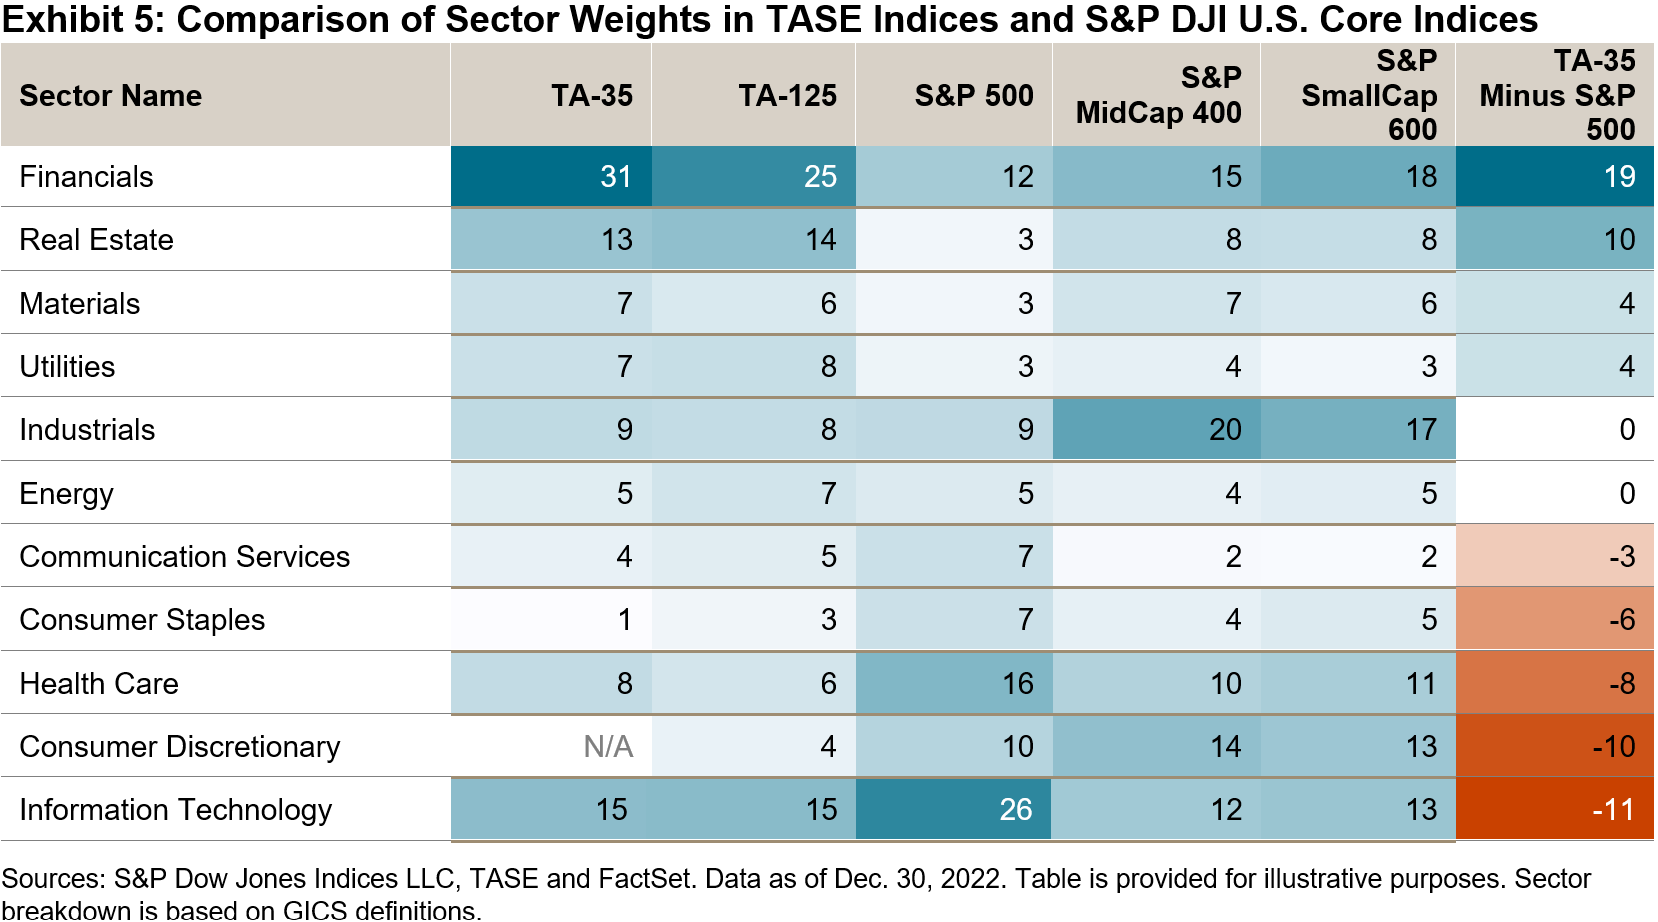
In addition to the potential performance and diversification benefits, incorporating U.S. equities may help Israeli investors to alleviate domestic sector biases. Compared to the S&P 500, Israeli equity indices like the TA-125 and TA-35 are heavily overweight Financials and Real Estate, while underweighting Information Technology by 11%, as shown in Exhibit 4b. The S&P 500’s largest constituents include some of the world’s most well-known “big tech” companies, such as Apple and Microsoft.
While U.S. equities are not the only way to seek diversification, investors may wish to evaluate their U.S. equity exposure in order to avoid overlooking a sizeable portion of the global opportunity set. A simple flourish of U.S. equities may not be enough to decorate a home, and so one may want to consider a real twist to measure the full potential of U.S. equities across capitalization ranges, especially as smaller U.S. equity segments are as large as other countries’ stock markets.
The posts on this blog are opinions, not advice. Please read our Disclaimers.