Categories
Commodities

Breakfast – The Most Important Meal of the Day

The first quarter of 2023 was a slow start to the year for commodities in general. The S&P GSCI Dynamic Roll Breakfast (OJ 5% Capped) also had a slow start, down 3.1%, after a solid 2022 performance of 14.12%. Maybe a higher weight to coffee would give the index the caffeine kick needed to boost performance—the S&P GSCI Coffee was up 5.8% for Q1 2023, as rising temperatures in the tropics lead to lower crop yields in the coffee-growing regions around the world. However, we would not be able to change the weightings of our breakfast index on a whim because it is based on world production of each of the six commodities making up the index.

The world’s food supply may continue to experience perilous geopolitical-based events like the Russia-Ukraine conflict, directly affecting nations who are some of the largest exporters of key grains, leading to price spikes like was seen last year with wheat. Other key agriculture-exporting regions are experiencing rising political instability, especially in some South American and North African countries.

While supply chain issues have mostly been resolved, the costs of production and transport will likely rise over time as every industry encounters scrutiny over carbon emissions. Major commodity producers regularly announce new plans to lower their carbon footprint, which will come at a higher cost but is needed to help combat climate change.

Compared to the headline benchmark S&P GSCI, breakfast commodities performed in a much less volatile manner over the last 20 years, as can be seen in Exhibit 2. The main reason is due to the lack of more volatile energy commodities that are included in the S&P GSCI. Unless gasoline is added to your morning coffee, breakfast tended to be a much smoother start to your day over the years, although there have been periods of much higher volatility for some of the individual breakfast commodities.

The S&P GSCI Dynamic Roll Breakfast (OJ 5% Capped) provides market participants with a new thematic way to look at commodities and offers a benchmark to key themes of food security against the backdrop of a rising global population. For more information on our commodities indices, please visit our website.
Categories
Commodities

Energy Markets Tumble in November

The S&P GSCI, the broad commodities benchmark, declined 10.8% over the month. The poor performance was driven almost exclusively by a major correction in energy prices, as the discovery of the Omicron COVID-19 variant cast a lengthening shadow over demand growth, added further complications to global supply chains, and dampened economic growth forecasts. The release of emergency oil stocks also played into the mix.

The U.S. and other large oil-consuming nations agreed to release emergency oil stocks during the month, a sign of the growing concern among policy makers of rising gasoline prices and the contribution of energy prices to escalating levels of inflation. The coordination came after the Biden administration failed to convince oil producers, including Saudi Arabia and Russia, to produce more oil to meet demand as the world recovers from the pandemic. China has yet to detail its reserve release. News of the release coupled with the emergence of the Omicron COVID-19 variant sent energy prices on a downward spiral over the closing days of the November. The S&P GSCI Petroleum fell 17.7%, while the S&P GSCI Natural Gas declined 17.3%.

Given the turmoil in the energy complex, it was surprising that the other industrial commodities sector, industrial metals, did not fall more steeply in November. The S&P GSCI Industrial Metals fell 2.0%, with the S&P GSCI Zinc suffering the biggest monthly decline, down 5.8% after hitting a 14-year high in October. The worst of the power-related disruption to Chinese refined zinc supply appear to have been resolved, and Chinese demand for zinc has waned.

The S&P GSCI Gold was flat for the month as caution picked up across financial markets, but the U.S. dollar hit a new one-year high. The biggest move came from the S&P GSCI Silver, which fell 4.9%, more in line with the industrial metals space. About one-half of silver demand is industrial in nature.

Within agriculture, while most commodities fell a few percentage points in sympathy with energy, there were two notable outperformers that helped to bring the S&P GSCI Agriculture to nearly flat for the month (down 0.8%). The S&P GSCI Kansas Wheat continued its run from October, moving higher by another 4.4%. The export duty imposed by Russia continued to keep the global wheat market tight. Egypt, the world’s largest importer of wheat, made its biggest single purchase since 2008, buying 600,000 metric ton. The S&P GSCI Coffee was the best performer in the agriculture complex for the month, rallying 12.4%, and it gained 68.2% YTD. Coffee prices hit a 10-year high in November when a perfect brew of catalysts came together. In South America, drought followed by frosts affected the crop, while freight disruptions continued to play a role, as coffee is typically refined in countries outside of the crop’s origin.

The S&P GSCI Livestock bounced back by 2.7% in November. Cattle prices led the way, as demand was strong and outpaced increased supplies. Beef cow slaughter was 9% higher year-over-year in the U.S.

Categories
Commodities

Coronavirus Hits Commodities Markets in February

The S&P GSCI, a widely recognized measure of broad commodities market beta, fell 8.4% in February. The global spread of coronavirus represents a simultaneous demand and supply shock, a situation that is close to unprecedented in global commodities markets. Across these markets, losses in February were driven by the petroleum complex and livestock, while even precious metals was not accretive to headline performance.

The S&P GSCI Petroleum was down 12.5% in February. The spread of coronavirus had a measurable impact on demand for petroleum products, and particularly so in China, where factories and transportation infrastructure in the worst-affected regions have been shut down for weeks. Oil prices tend to reflect current physical supply and demand conditions, which means that they are often the first to respond to slowdowns in global economic activity, particularly if they are caused by a demand shock. The International Energy Agency (IEA) cut its 2020 global oil demand estimates in mid-February. The IEA is now forecasting a 435,000 barrel per day drop in global oil demand year over year for Q1 2020; this would be the first quarterly drop in demand in more than 10 years. On the supply side, OPEC+ has yet to react to the virus-related slump in demand by making additional production cuts. After only two months, the S&P GSCI Brent Crude Oil was down 24% year to date.

Gold remains one of the only bright spots in the commodities complex, but even it came under some pressure at the end of February, with the S&P GSCI Gold falling 1.2% in February. Gold’s popularity among investors has risen over the past 12 months in response to heightened global geopolitical tensions and falling global interest rates. This popularity was buoyed even further by the spread of coronavirus, which has added a new layer of uncertainty and complexity to global financial markets. Gold can benefit during periods of financial ambiguity and when investors’ appetite for risk is tempered, because it is viewed as an excellent store of value and in many cases can be held outside of the traditional financial market ecosystem.

Relative to other commodities, the S&P GSCI Industrial Metals exhibited a muted decline of 1.2% for the month. Looking beneath the surface, there was more disparity. Most metals declined, but the S&P GSCI Zinc was down the most, declining 8.4% and catching up with the underperformance seen in January from the rest of the base metals. Zinc inventory levels hit a 20+ year low at the London Metal Exchange on Feb. 4, 2020, but supply then shot higher by over 50% a few days later, helping to exacerbate the move lower in price. On a positive note and after a double-digit down month in January, the S&P GSCI Copper showed some signs of life, up 1.4% in February.

The S&P GSCI Agriculture fell 2.9% in February. Losses were spread evenly across the grains and softs markets, with only coffee bucking the trend. The S&P GSCI Coffee ended the month up 6.4%, enjoying somewhat of a bounce that was driven by tighter supplies of washed, quality coffee and speculators starting to liquidate short positions.

Live cattle prices plunged in February, leaving the S&P GSCI Livestock down 6.1% for the month. The potential spread of coronavirus in the U.S. has especially negative implications for beef demand given that beef is the most important meat protein in the foodservice sector and is also the most expensive animal protein source.

Categories
Commodities

Coffee Drips to a New Low

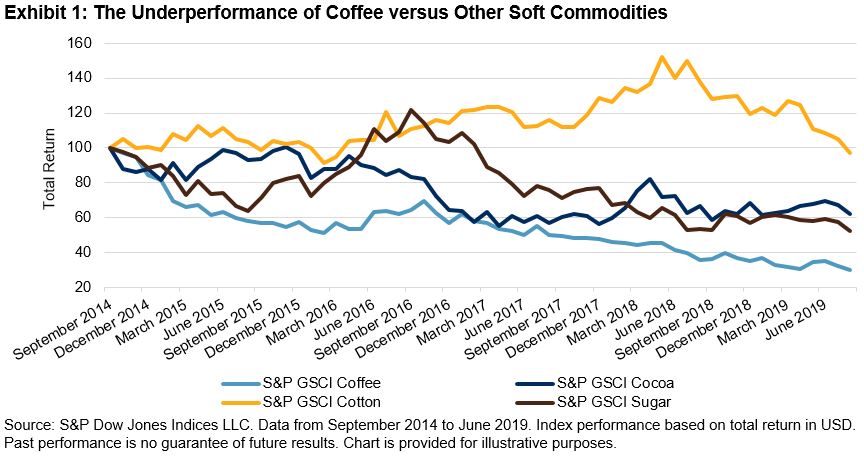
Over the past five years, the S&P GSCI Coffee underperformed the other soft commodities, as can be seen in Exhibit 1. Broad oversupply issues that have been seen in most commodities have been particularly pronounced in the coffee market. In addition to the major coffee-producing countries’ respective economic problems, these countries also generally suffer from high exposure to commodities, a strong U.S. dollar, and the ripple effect of the ongoing trade war between the U.S. and China. One alternative to stem the price decline may be for these countries to collaborate, similar to the way cocoa-producing countries do. In July 2019, Ghana and Côte d’Ivoire reached an agreement for a price floor in an attempt to counteract the lower cocoa prices in the past few years.

The supply picture is not helping coffee at the moment. In early September 2019, the International Coffee Organization increased its 2018-2019 global surplus estimate to 4.96 million bags from 3.92 million bags estimated the prior month. This estimate compares with the 2017-2018 surplus of 2.05 million bags and would be the second consecutive year with a surplus. This contrasts with a deficit of 1 million bags during 2016-17, and so the oversupply is worsening even with demand picking up globally.

Two of the top three coffee-producing countries have experienced big shifts in their economies over the past five years. Brazil, the largest exporter with 16% of global coffee exports, recently came out of a multi-year recession ending in 2017. Meanwhile, Colombia’s GDP was cut in half over that time as its exports declined by an annualized rate of 9%. About half of Colombia’s exports are crude petroleum and coal, two markets that, along with coffee, experienced extensive price declines over the past five years. Vietnam was the only one of the top three exporters to see an uptick in economic growth, although recent growth forecasts have been more pessimistic owing to elevated debt levels and large fiscal deficits. The World Bank believes Vietnam’s real GDP peaked in 2018.

Coffee consumption globally continues to creep higher, but due to the latest record harvests in Brazil, coffee prices have continued to decline. Starbucks recently proposed it may see a boost from lower costs, as the company projects coffee prices to continue to underperform. However, it is unclear where coffee prices might go from here given the uncertainty present in the global economy and associated levels of consumer consumption. Tastes and habits of consumers are also constantly shifting throughout the world. The S&P GSCI Coffee is designed to provide investors with a reliable and publicly available benchmark for investment performance in the coffee market. S&P Dow Jones Indices offers different versions of this index to cater to the needs of market participants. These versions include enhanced roll yields, dynamic roll yields, covered calls, forwards, and currency and regional indices. Single-commodity indices could offer investors an efficient way to access the return streams of unique assets such as coffee.