Get Indexology® Blog updates via email.

In This List

Global Islamic Indices Declined Over 20% YTD, Underperforming Conventional Benchmarks in 2022

Style, Size, and Skewness

Understanding an Icon: 30 Years of Indexing the S&P 500

When the Winds Change

Contextualizing Style Shifts

Global Islamic Indices Declined Over 20% YTD, Underperforming Conventional Benchmarks in 2022

Contributor Image
Eduardo Olazabal

Associate Director, Global Exchange Indices

S&P Dow Jones Indices

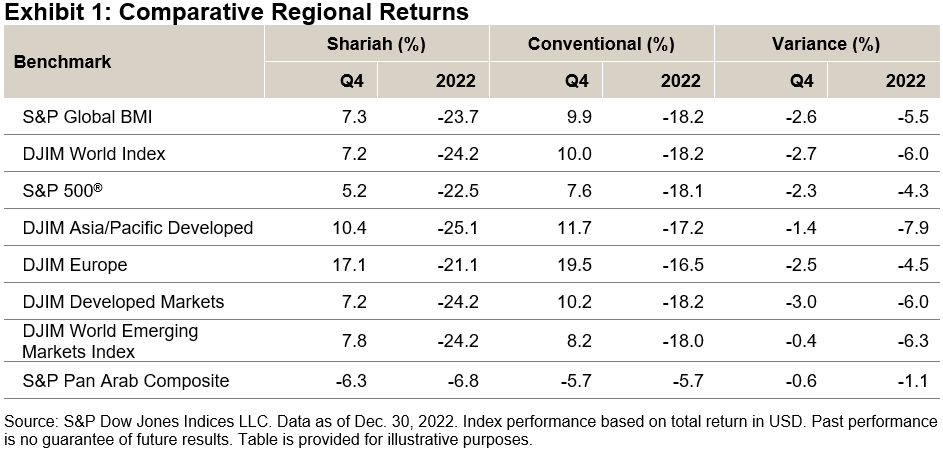
Global equities partially recovered from the losses accumulated throughout the year by increasing 9.9% during Q4, as measured by the S&P Global BMI, ending 2022 with a loss of 18.2%. Meanwhile, Shariah-compliant benchmarks, including the S&P Global BMI Shariah and Dow Jones Islamic Market (DJIM) World Index, also increased during the quarter, but they underperformed their conventional counterparts by 2.6% and 2.7% respectively.

Overall regional broad-based Shariah and conventional equity benchmarks posted a positive quarter, as inflation started to cool down across the world. However, the Pan Arab region declined 5.7% in Q4, and its Shariah benchmark finished the quarter with a decrease of 6.3%.

Drivers of Shariah Index Performance in Q4 and in 2022

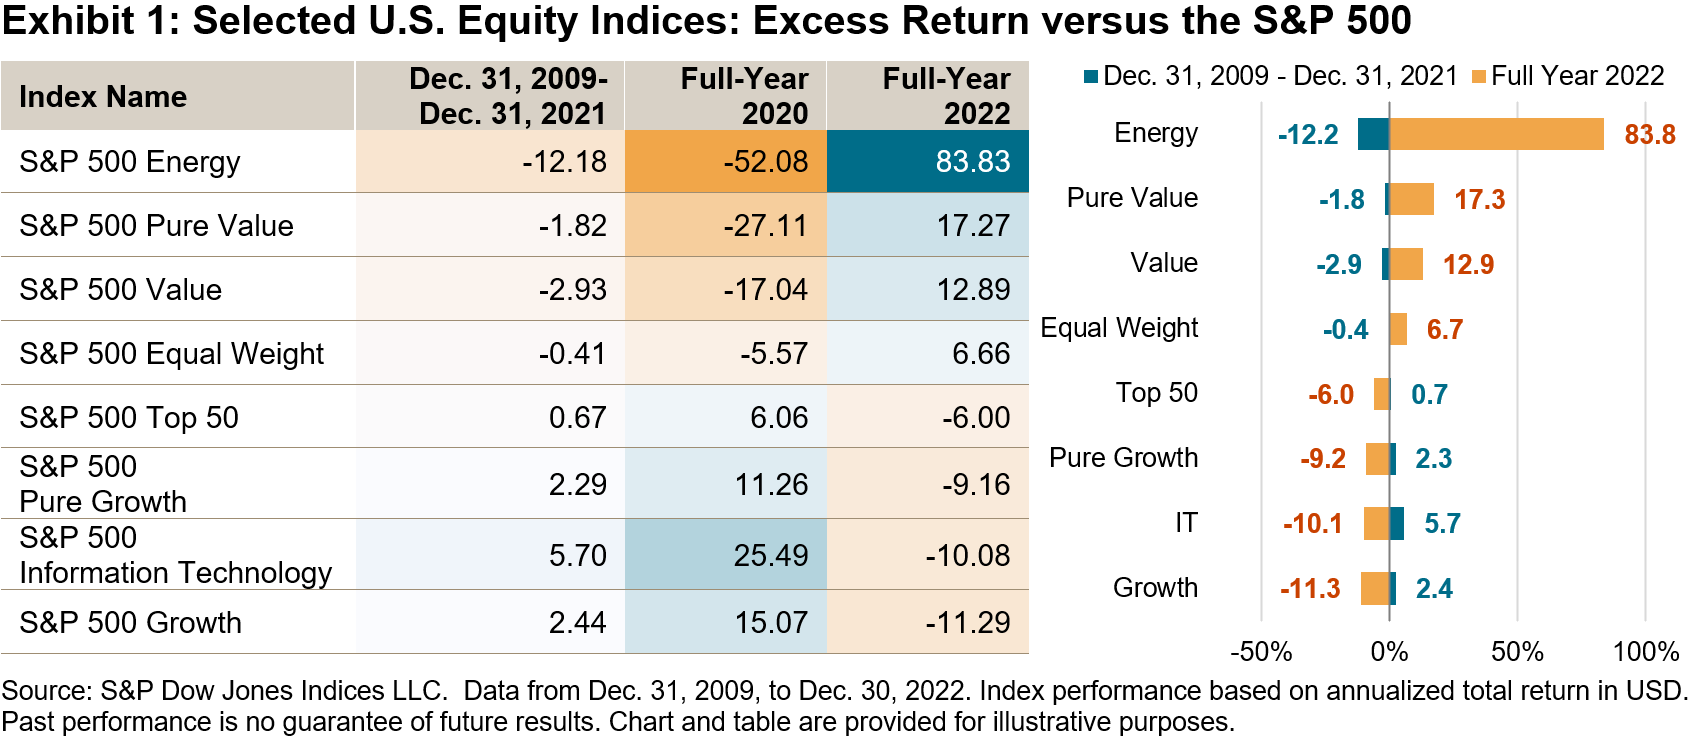
While 2022 was a negative year in terms of equity index performance, Q4 saw a partial recovery. Nevertheless, Shariah benchmarks underperformed their conventional counterparts during the quarter and over the year. Sector composition can provide some explanation to this quarter’s results. Higher exposure to Information Technology stocks within Islamic indices continued to weigh on returns, as IT shares didn’t benefit as much from this rally, up only 5.7% in Q4, while the sector was down 31.6% for the year.

Meanwhile, other sectors posted double-digit gains. For example, Energy went up by 19.6% in Q4 and finished the year with a gain of 45.7% but had a relatively small weight of 3.6% in the S&P Global BMI Shariah. The same can be said for Materials, which gained 14.6% during the quarter but only represented 6% of the index’s weight.

Consumer Discretionary and Communications Services were the only sectors that decreased during Q4. The impact from the latter was muted by its small weight; however, Consumer Discretionary made a negative contribution of 0.7% to the index’s return owing to its larger share of 13.3%.

Mixed Results in MENA Equities in 2022

MENA regional equities experienced mixed results in Q4 and in 2022. The regional S&P Pan Arab Composite ended the year down by 5.7%. GCC annual country performance was also mixed, with positive returns for Oman (up 25.8%) and Bahrain (up 9%), and losses in Qatar (-8.3%), Saudi Arabia (-7.2%) and the UAE (-3.7%).

For more information on how Shariah-compliant benchmarks performed in Q4 2022, read our latest Shariah Scorecard

This article was first published in IFN Volume 20 Issue 2 dated Jan. 11, 2023.

The posts on this blog are opinions, not advice. Please read our Disclaimers.

Style, Size, and Skewness

Contributor Image
Anu Ganti

U.S. Head of Index Investment Strategy

S&P Dow Jones Indices

Two of the biggest reversals of 2022 compared to 2021 were the outperformance of smaller caps and the outperformance of value compared to growth. Both of these factors helped drive the S&P 500® Equal Weight Index’s recovery last year, as well as a decline in market concentration.

As sector and style exposures are not independent, another consequence of the turnaround in value’s performance and the demise of growth stocks was a seismic shift in the sector composition of our value and growth indices, resulting in record turnover for both the S&P 500 Growth and S&P 500 Value indices in their December reconstitution.

To understand better the interaction between the decline in market concentration and the shift in style index composition, we can examine concentration trends through a style lens using the Herfindahl-Hirschman Index (HHI), which reveals striking results. While S&P 500 Value’s concentration levels ticked up slightly, Exhibit 1 illustrates that after a dramatic rise since 2019, S&P 500 Growth concentration declined significantly, not seen since the burst of the tech bubble starting in 2000.

The plummeting of Growth concentration was reflected in shifts in the factor composition of the index, the most prominent of which was a reduction of the strategy’s large-cap bias.  In addition, Exhibit 2, which depicts S&P 500 Growth’s factor tilts relative to the S&P 500, shows its reduced exposure to the Momentum and High Beta factors.

We can attempt to understand the implications of the increase in Growth’s small-cap exposure for active managers by analyzing the index’s distribution of returns. Exhibit 3 illustrates that in 2021, which was a stellar year for S&P 500 Growth, given the dominance of its mega caps, the distribution of the index’s stock returns was positively skewed, with the average return above that of the median, implying that only a minority of constituent stocks outperformed the index. In contrast, in 2022, S&P 500 Growth was the worst performing factor index, and the distribution of stock returns became negatively skewed as a result of the relative outperformance of smaller caps, lowering the threshold for success.

But despite this tailwind, the H1 2022 SPIVA results for growth managers were consistently discouraging across the cap spectrum, perhaps also indicating the potential inability of growth managers to tilt toward outperforming value stocks. While it remains to be seen whether managers were able to take advantage of the relatively more hospitable skewness environment during the latter part of last year, one thing is certain—the changing nature of our indices’ style, size and skewness characteristics.

The posts on this blog are opinions, not advice. Please read our Disclaimers.

Understanding an Icon: 30 Years of Indexing the S&P 500

How has the adoption of passive investing grown since the first U.S. ETF on the S&P 500 launched 30 years ago? S&P DJI’s Tim Edwards and Elizabeth Bebb join SPDR ETF’s Rebecca Chesworth to discuss the global role of the S&P 500.


The posts on this blog are opinions, not advice. Please read our Disclaimers.

When the Winds Change

Contributor Image
Sherifa Issifu

Senior Analyst, U.S. Equity Indices

S&P Dow Jones Indices

“Change is the investor’s only certainty.”

Thomas Rowe Price, Jr.

2022 marked several major changes in market trends amid a substantial shift in global macroeconomic regimes. After historic levels of stimulus, multi-decade highs in inflation across several major economies led to monetary tightening. This shift weighed on asset classes in many regions, and traditional routes of diversification proved problematic as bonds and equities fell in tandem. In U.S. equities, growth, mega-cap and “big tech”, dominance gave way to a resurgence in value, as well as outperformance from smaller companies and Energy. Exhibit 1 summarizes the changing trends observed in 2022 in sharp contrast to 2020 and since the start of the 2010s, by showing the excess returns of various indices versus the S&P 500®.

The S&P 500 Pure Value was one of the few indices to remain near flat in 2022, falling 1% compared to the S&P 500’s 18% decline. The S&P 500 Value and S&P 500 Equal Weight Index also outperformed by 13% and 7%, respectively. Exhibit 2 shows the consistent outperformance of these indices throughout 2022. All three indices benefited from their greater exposure to value-oriented companies last year, as growth-oriented companies came under particular pressure amid interest rate hikes.

Growth has had a symbiotic relationship with the Communication Services, Consumer Discretionary and Information Technology sectors. Unsurprisingly, growth’s underperformance had a particularly large impact on these sectors, as they declined 40%, 37% and 28%, respectively. On the opposite side of the sector spectrum, the S&P 500 Energy led the way as it gained 66% on the back of higher oil prices. Energy’s momentum contributed to the widest spread (best minus worst) in calendar year sector returns on record (see Exhibit 3).

2022 reminds us that change is a constant of life. Being equipped with a full range of index-based tools can help market participants manage within different market regimes.

The posts on this blog are opinions, not advice. Please read our Disclaimers.

Contextualizing Style Shifts

Contributor Image
Hamish Preston

Head of U.S. Equities

S&P Dow Jones Indices

The S&P U.S. Style Indices are designed to provide broad and exhaustive exposure to the market’s value and growth segments. Our index methodology bifurcates a parent index’s market capitalization into roughly equal portions on the third Friday in December, using six measures shown in Exhibit 1. 

Although the composition of style indices changes every year, Exhibit 2 shows that the 2022 reconstitution saw record turnover. For example, 31% and 32% of the market capitalization of the S&P 500 Value and the S&P 500 Growth, respectively, was affected by the December 2022 style review. These one-way turnover figures were higher than for any annual reconstitution since the current style measures were adopted in 2009.

Exhibit 3 shows that there were several notable shifts in S&P 500 Growth’s sector exposures as a result of the latest style reconstitution. For example, Energy’s weight increased from 1.4% to 8.0%. Although Energy’s post-rebalance weight was not unprecedented—Energy companies accounted for more than 12% of the growth index in 2009 and 2011—the 6.6% increase in the sector’s weight was the largest increase at a style reconstitution since 2009. Health Care’s representation also rose by its biggest amount since 2009, by 8% to 21.4%, leaving the sector with its highest post-rebalance weight over the same horizon.

Similarly, Exhibit 4 shows large sector shifts in the S&P 500 Value. Its exposures to Financials, Consumer Discretionary and Communication Services increased by their largest margins since 2009, rising by 5.3%, 4.0% and 2.6%, respectively. And while Information Technology’s post-rebalance weight (16.8%) was not unprecedentedly high—it represented a greater portion leading into the December 2019 style review—the 6% increase in its weight was second only to its 8% increase during the 2018 rebalance.

These sectoral shifts reflect the impact of 2022’s trends on companies’ latest style classifications.  For example, Energy companies benefited from surging commodity prices last year, as the S&P 500 Energy sector recorded its highest calendar year total return ever (up 66%). This dynamic contributed to seven Energy companies migrating fully from the S&P 500 Value to the S&P 500 Growth. Their momentum scores were all winsorized to the highest value, and their earnings change and sales growth figures also ranked highly. Exhibit 5 shows that some of these Energy companies were among the largest in the S&P 500 Growth post rebalance.

Exhibit 6 shows that 6 of the 10 largest constituents in S&P 500 Value had a greater proportion of their float market cap (FMC) allocated to S&P 500 Value after the latest rebalance. Some of the largest, historically growth-oriented companies in Communication Services, Consumer Discretionary and Information Technology were particularly affected by rising interest rates in 2022. Unsurprisingly, the momentum descriptor contributed to these companies becoming more value-oriented. Meanwhile, the earnings of several Financials companies benefited from higher interest rates, lowering their earnings-to-price ratios and thus contributing to their becoming more value oriented.

2022’s market trends affected companies’ style classifications and led to sizeable changes in sector exposures for the S&P 500 Growth and S&P 500 Value. These changes are important to understand the evolution of the indices’ characteristics and when assessing their performance.

The posts on this blog are opinions, not advice. Please read our Disclaimers.