Get Indexology® Blog updates via email.

In This List

Contextualizing Style Shifts

A Spider Spins a SPIVA Special

Results from the Recent S&P 500 Net Zero 2050 Paris-Aligned Sustainability Screened Index Rebalance

Style Chicken or Sectoral Egg?

SPIVA and the Case for Indexing

Contextualizing Style Shifts

Contributor Image
Hamish Preston

Head of U.S. Equities

S&P Dow Jones Indices

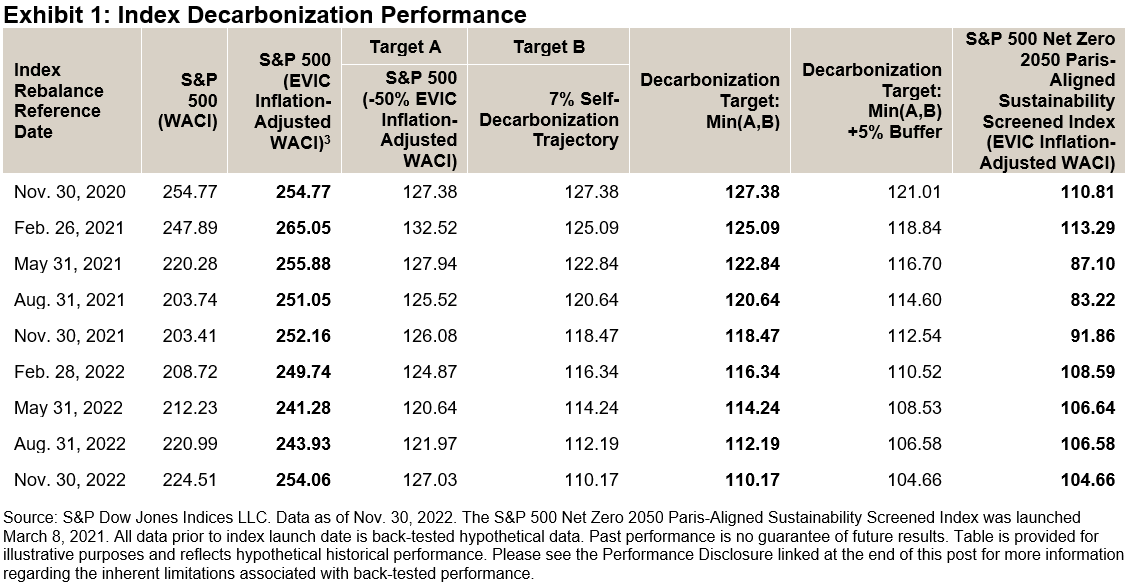
The S&P U.S. Style Indices are designed to provide broad and exhaustive exposure to the market’s value and growth segments. Our index methodology bifurcates a parent index’s market capitalization into roughly equal portions on the third Friday in December, using six measures shown in Exhibit 1. 

Although the composition of style indices changes every year, Exhibit 2 shows that the 2022 reconstitution saw record turnover. For example, 31% and 32% of the market capitalization of the S&P 500 Value and the S&P 500 Growth, respectively, was affected by the December 2022 style review. These one-way turnover figures were higher than for any annual reconstitution since the current style measures were adopted in 2009.

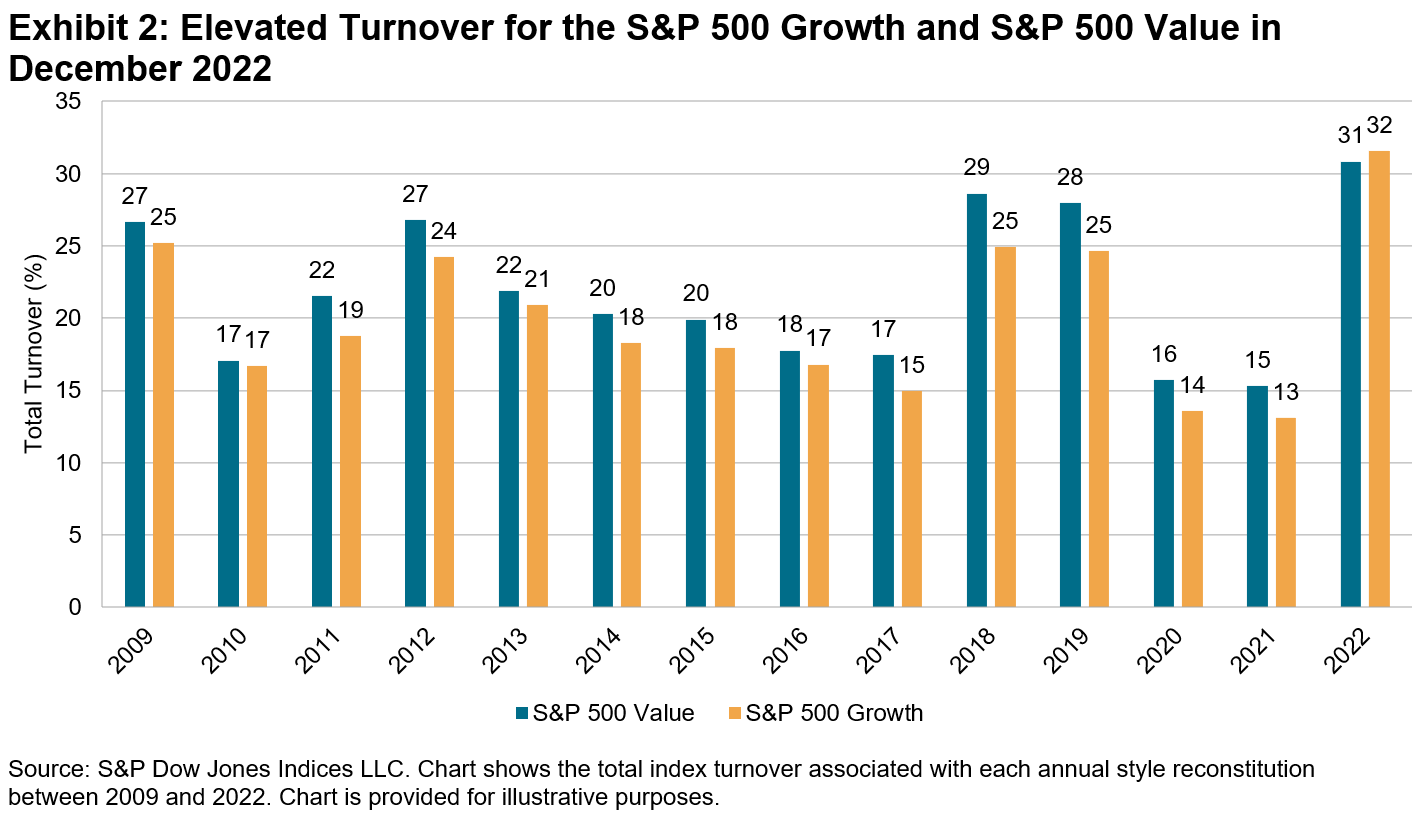
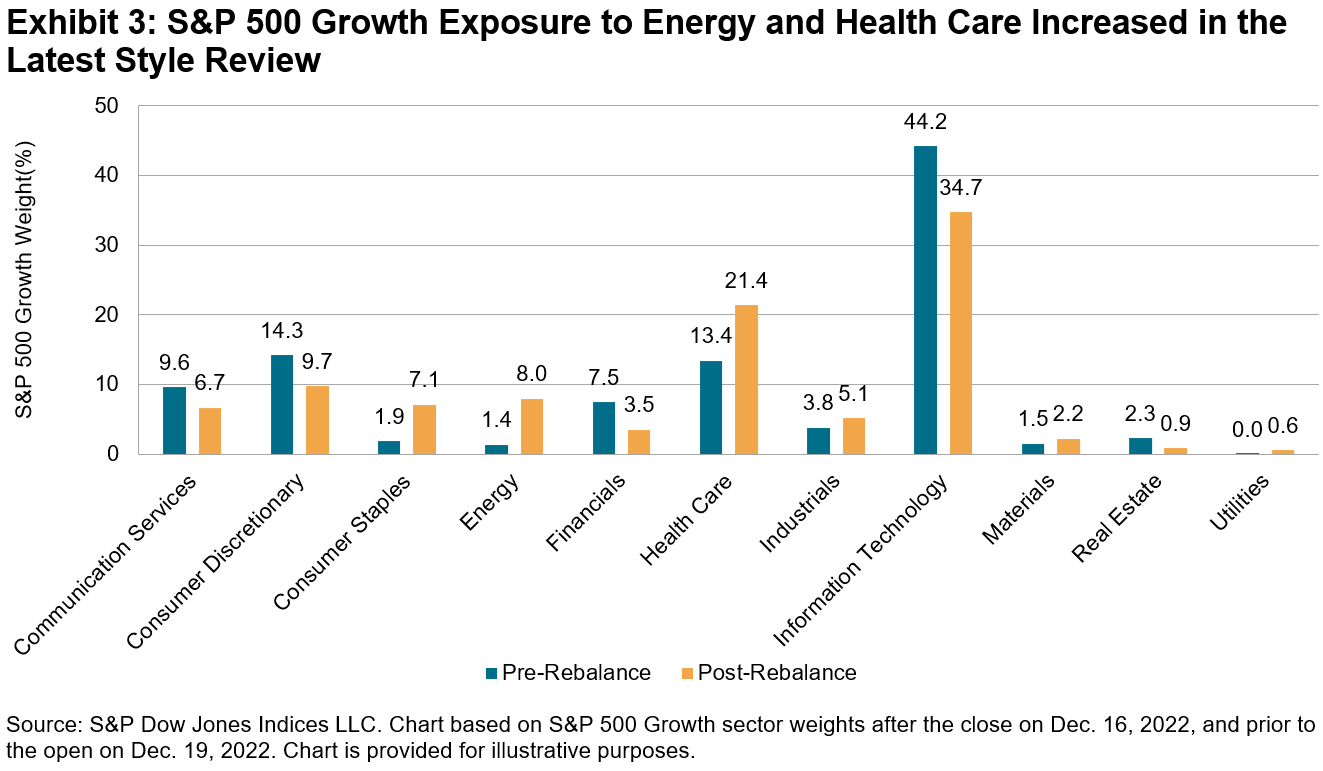
Exhibit 3 shows that there were several notable shifts in S&P 500 Growth’s sector exposures as a result of the latest style reconstitution. For example, Energy’s weight increased from 1.4% to 8.0%. Although Energy’s post-rebalance weight was not unprecedented—Energy companies accounted for more than 12% of the growth index in 2009 and 2011—the 6.6% increase in the sector’s weight was the largest increase at a style reconstitution since 2009. Health Care’s representation also rose by its biggest amount since 2009, by 8% to 21.4%, leaving the sector with its highest post-rebalance weight over the same horizon.

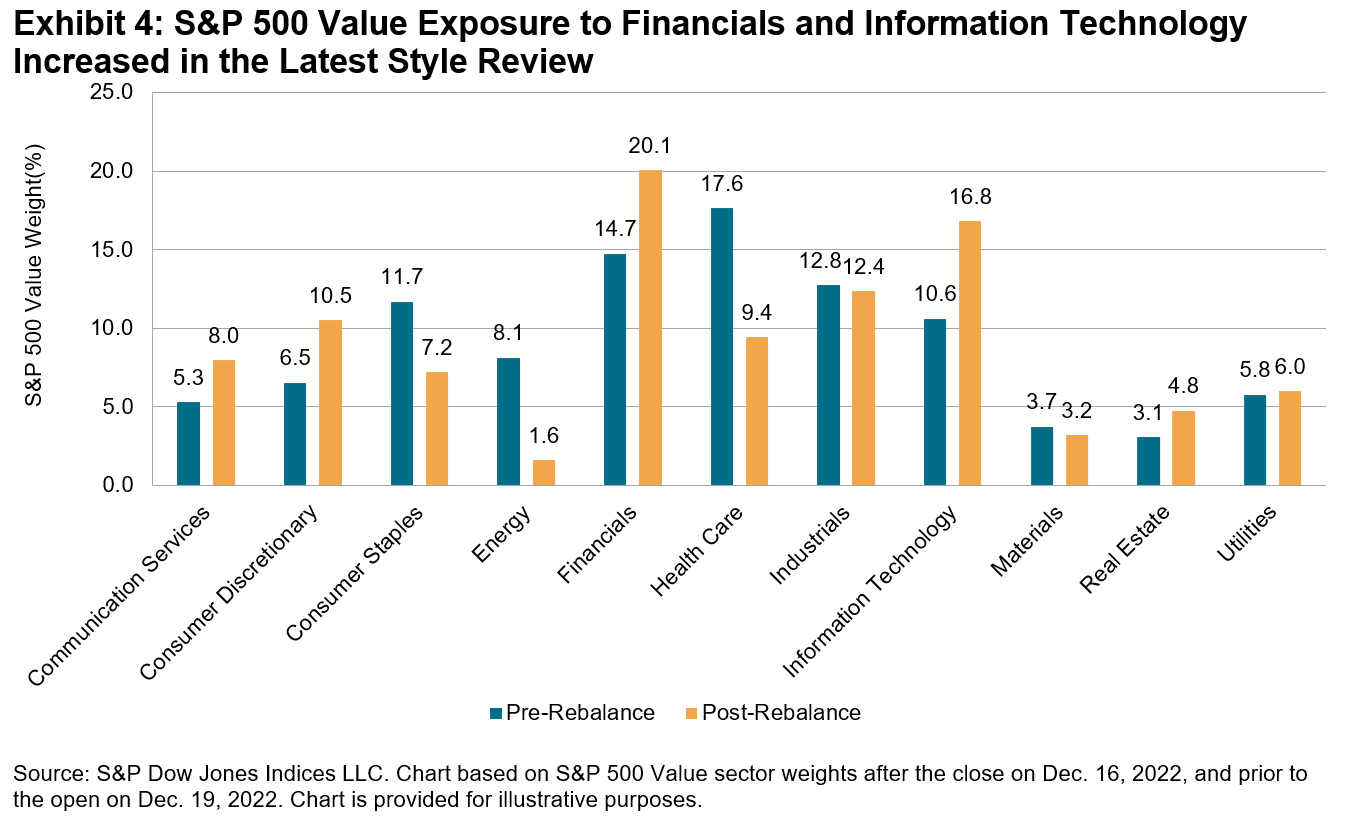
Similarly, Exhibit 4 shows large sector shifts in the S&P 500 Value. Its exposures to Financials, Consumer Discretionary and Communication Services increased by their largest margins since 2009, rising by 5.3%, 4.0% and 2.6%, respectively. And while Information Technology’s post-rebalance weight (16.8%) was not unprecedentedly high—it represented a greater portion leading into the December 2019 style review—the 6% increase in its weight was second only to its 8% increase during the 2018 rebalance.

These sectoral shifts reflect the impact of 2022’s trends on companies’ latest style classifications.  For example, Energy companies benefited from surging commodity prices last year, as the S&P 500 Energy sector recorded its highest calendar year total return ever (up 66%). This dynamic contributed to seven Energy companies migrating fully from the S&P 500 Value to the S&P 500 Growth. Their momentum scores were all winsorized to the highest value, and their earnings change and sales growth figures also ranked highly. Exhibit 5 shows that some of these Energy companies were among the largest in the S&P 500 Growth post rebalance.

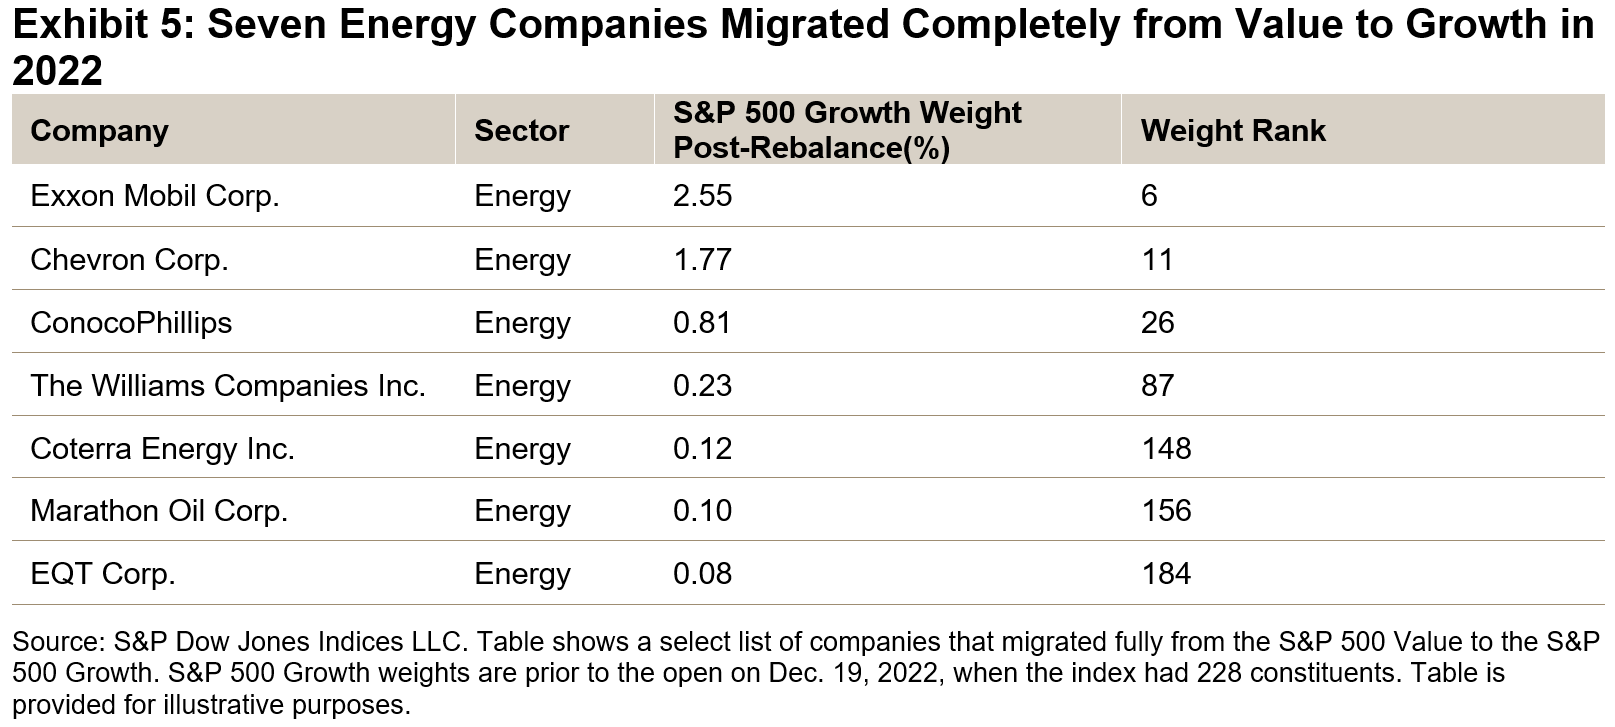
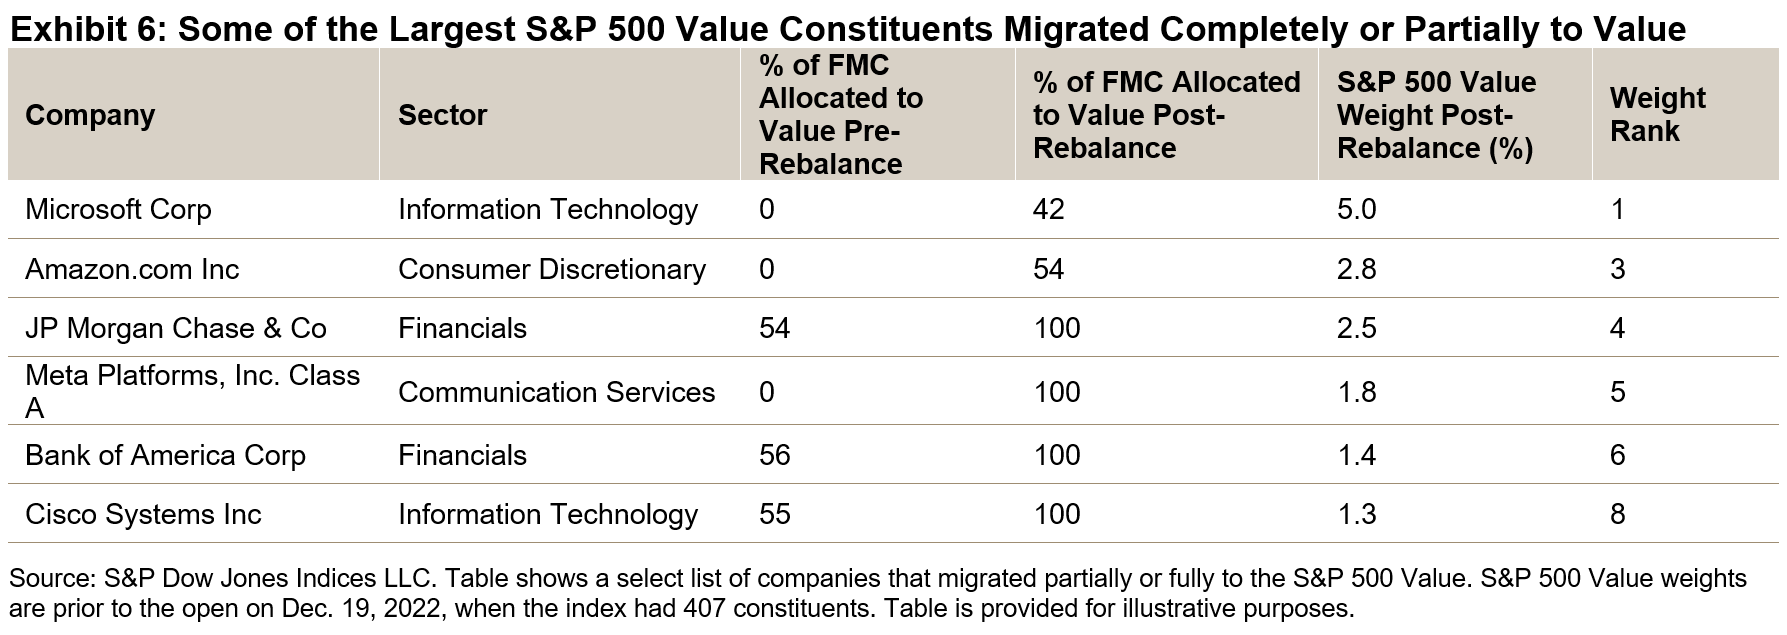
Exhibit 6 shows that 6 of the 10 largest constituents in S&P 500 Value had a greater proportion of their float market cap (FMC) allocated to S&P 500 Value after the latest rebalance. Some of the largest, historically growth-oriented companies in Communication Services, Consumer Discretionary and Information Technology were particularly affected by rising interest rates in 2022. Unsurprisingly, the momentum descriptor contributed to these companies becoming more value-oriented. Meanwhile, the earnings of several Financials companies benefited from higher interest rates, lowering their earnings-to-price ratios and thus contributing to their becoming more value oriented.

2022’s market trends affected companies’ style classifications and led to sizeable changes in sector exposures for the S&P 500 Growth and S&P 500 Value. These changes are important to understand the evolution of the indices’ characteristics and when assessing their performance.

The posts on this blog are opinions, not advice. Please read our Disclaimers.

A Spider Spins a SPIVA Special

Contributor Image
Tim Edwards

Managing Director, Index Investment Strategy

S&P Dow Jones Indices

Thirty years ago, Bill Clinton was getting ready for his inauguration as the 42nd U.S. president, the S&P 500® closed a little over 430 and the latest edition of Business Week was trumpeting that 1993 would be “The Year of Picking Wisely” in the stock market. Meanwhile, a different kind of security was about to make its revolutionary debut on the New York Stock Exchange; one that would make it possible to trade a whole index-worth of stocks, all at once.

On Jan. 29, 2023, the world’s longest-surviving exchange-traded fund—initially known as the Standard & Poor’s Depository Receipt or by the acronym SPDR (the “Spider”)—will celebrate 30 years since it began trading. Now among the largest funds in the world, and on some days the most heavily traded security anywhere, we mark the anniversary with a one-off special edition of our SPIVA® analysis, covering the 29-and-a-bit years since that launch.

Exhibit 1 compares the performance of actively managed U.S. equity mutual funds over the nearly 30-year period, using the same analytical engines and data sources as our regular SPIVA U.S. Scorecards and based on the nearest quarter ends. Statistics for the U.S. large-cap core category and all domestic U.S. equity active funds are highlighted.

The figures tell a remarkable story. Over the full period, just 2% of actively managed Large-Cap Core funds beat the S&P 500. Even in categories such as small- and mid-sized stocks, and growth—which benefited from the tailwinds of an outperforming universe—a minimum of 81% of actively managed funds underperformed the benchmark. Overall, across all categories, 90% of actively managed funds underperformed the S&P 500.

The higher fees typically charged by actively managed funds may be part of the reason that so many funds underperformed, although other factors may have also been at play. Index funds and ETFs charge fees too, but the results of Exhibit 1 would not be significantly altered when accounting for them. Even among surviving funds—which we might well suppose generally performed better—57% of domestic funds underperformed the S&P 500 by more than a percentage point per year. To illustrate the range of returns, Exhibit 2 plots the distribution of annualized returns for all the actively managed domestic equity funds that survived to post a full-period return. It also shows the breakdown of fund survivorship. For reference, the “Spider” had an initial fee of 0.2% annually (it was later reduced to just under 0.1%).

Investing in an index tracker was seen (by some) as an admission of defeat back in early 1993. At best, an index fund was “settling for average.” But, as it turns out, a portfolio approximately replicating the S&P 500’s return would have been emphatically above average since then. For the Spider that spun such silk, I hope you’ll join the S&P DJI team in wishing it a very happy 30th birthday.

The posts on this blog are opinions, not advice. Please read our Disclaimers.

Results from the Recent S&P 500 Net Zero 2050 Paris-Aligned Sustainability Screened Index Rebalance

Contributor Image
Narottama Bowden

Director, Sustainability Indices Product Management

S&P Dow Jones Indices

The author would like to thank Clara Arganaraz, Index Manager of the S&P 500® Net Zero 2050 Paris-Aligned Sustainability Screened Index, for her contributions to this post.

S&P Dow Jones Indices recently completed the rebalancing of all indices that aim to meet the minimum requirements for EU Climate Transition and EU Paris-Aligned Benchmarks.1 This includes the rebalancing of the S&P 500 Net Zero 2050 Paris-Aligned Sustainability Screened Index, which is designed to measure the performance of eligible equity securities from the S&P 500, selected and weighted to be collectively compatible with a 1.5ºC global warming climate scenario at the index level, among other climate, environmental and sustainability objectives.

The index is designed to achieve a variety of ESG objectives through the use of sustainability screening in its eligibility criteria and an optimization process in constituent selection and weighting, including a reduced overall greenhouse gas (GHG; expressed in CO2 equivalents) emissions intensity compared to its underlying index (the S&P 500) by at least 50%. The index also includes a minimum self-decarbonization rate of GHG emissions intensity in accordance with the associated trajectory implied by the Intergovernmental Panel on Climate Change’s (IPCC) most ambitious 1.5ºC scenario, equating to at least a 7% GHG intensity reduction on average per year.

As of the index’s Nov. 30, 2022, rebalancing reference date (and all previous rebalances), the index’s enterprise value including cash (EVIC) inflation-adjusted weighted-average carbon intensity (WACI)2 achieved its required level of decarbonization—the minimum of either half the S&P 500 WACI or its 7% self-decarbonization trajectory WACI as at the rebalance reference date. The index achieved a relative decarbonization to the underlying index of 58.80% at an EVIC inflation-adjusted WACI at the required level (104.66).

The index seeks to achieve a variety of other objectives simultaneously, and once more, was able to achieve them successfully at the recent rebalance.

  • The index’s weighted-average 1.5˚C Climate Transition Pathway Budget Alignment4 was marginally below zero, implying the index is 1.5˚C Climate Scenario-aligned at the index level.5
  • The index’s weighted-average S&P DJI Environmental Score achieved the minimum level required at this rebalance (72.45) based on this constraint in the methodology, also exceeding the score of the underlying index (65.65).
  • The index’s high climate impact sectors revenues exposure was at least as high as in the underlying index, as required by the minimum standards for EU Climate Transition Benchmarks and EU Paris-aligned Benchmarks.
  • The index had a lower exposure to companies deemed to insufficiently disclose their GHG emissions, at a level well below its maximum exposure permitted by the methodology.
  • The index did not have any exposure to companies with fossil fuel reserves, despite the methodology permitting a maximum of 20% of the exposure of the underlying universe.
  • The index-level physical risk score (31.74) was at the required level as of the rebalance, as defined by the methodology, and it was lower than the underlying index’s score (35.27).6

The index’s ratio of green revenues to brown revenues was four times higher than in the underlying index, as required by the methodology.

The S&P 500 Net Zero 2050 Paris-Aligned Sustainability Screened Index seeks to achieve a range of climate change, environmental and sustainability objectives, and again the index has met these ambitions.

1 Commission Delegated Regulation (EU) 2020/1818 of 17 July 2020 supplementing Regulation (EU) 2016/1011 of the European Parliament and of the Council as regards minimum standards for EU Climate Transition Benchmarks and EU Paris-aligned Benchmarks. https://eur-lex.europa.eu/legal-content/EN/TXT/PDF/?uri=CELEX:32020R1818&from=EN

2 Measures are calculated in metric tons of carbon dioxide-equivalent emissions per USD 1 million of EVIC (tCO2e/USDmn). For more information on how this metric is calculated, see “Weighted-Average Carbon Intensity (WACI)” in the Constraint-related Definitions section of the S&P 500 Net Zero 2050 Paris-Aligned Sustainability Screened Index Methodology.

3 For more information on how the WACI is adjusted for EVIC inflation, see ‘Inflation Adjustment’ in Section 3, Part 4 of the EU Required ESG Disclosures Appendix in the S&P Paris-Aligned & Climate Transition Index Family Benchmark Statement.

4 For more information on how this metric is calculated, see the Constraint-related Definitions and Optimization Constraints sections of the S&P 500 Net Zero 2050 Paris-Aligned Sustainability Screened Index Methodology, and the S&P Dow Jones Indices: ESG Metrics Reference Guide.

5 A measure at or below zero means the index is 1.5˚C Climate Scenario-aligned at the index level.

6 A lower score is associated with less physical risk exposure at the index level.

The posts on this blog are opinions, not advice. Please read our Disclaimers.

Style Chicken or Sectoral Egg?

Contributor Image
Craig Lazzara

Former Managing Director, Index Investment Strategy

S&P Dow Jones Indices

Anyone who has perused our S&P 500® Factor Dashboard for December 2022 (and it’s a shame if you have not) will recognize Exhibit 1 below. The horizontal axis represents the difference between the weighted average value and growth scores (at the beginning of 2022) for each of the 17 factor indices in our dashboard, while the vertical axis shows each index’s 2022 performance relative to the S&P 500.

Exhibit 1 shows that the value-growth differential explained nearly 80% of the variation in performance across factor indices last year. The importance of style exposures in explaining factor index returns is unsurprising given the significant spread between Value and Growth returns in 2022. S&P 500 Value outperformed S&P 500 Growth by 24% last year, Value’s biggest winning margin since 2000, and the fourth highest since 1995.

Style scores are not the only potential explanatory variable; sector exposures can also be relevant in analyzing relative returns. Information Technology, the largest sector in the S&P 500, underperformed the benchmark by 28% in 2022, and Exhibit 2 shows the relationship between each factor index’s IT weight and its relative performance. This simple metric has even more predictive power than the spread between an index’s value and growth scores.

But sector and style exposures are not independent. In 2022, IT was the sector most underweighted in S&P 500 Value and most overweighted in S&P 500 Growth. Alternatively, of the S&P 500’s 11 sectors, IT had both the lowest weighted average value score and the highest weighted average growth score. This raises an obvious question: did IT underperform because it was expensive and fast-growing, or did Value outperform (and Growth underperform) because of their IT weightings?

We can address this question by ranking the S&P 500’s constituents by the difference between their value and growth scores, and then dividing the index into quintiles. Consider the quintile with the biggest difference between value and growth scores, a combination of cheapness and relatively slow growth. IT composed 7.4% of the weight of this quintile, and those issues represented 5.0% of the weight of the IT sector. Between 7.4% and 5.0%, there’s not much to choose.

At the opposite end of the scale—the “expensive, fast growth” or “EFG” quintile—there is a much bigger distinction. Exhibit 3 shows that IT companies represented 81% of the EFG quintile’s weight. The same “expensive, fast growth” companies made up 64% of the IT sector. In other words, the IT sector had much more exposure to non-EFG names than the EFG quintile had to companies from sectors other than IT.

On this basis, it’s fair to say that IT was more important to the expensive, fast growth quintile than members of that quintile were to the IT sector. This is a particular result rather than a general observation. At other times and with other sectors and factors, the conclusion might well be different. But in 2022, it appears that the IT sector was more important to the interplay of value and growth than that interplay was to IT.

The posts on this blog are opinions, not advice. Please read our Disclaimers.

SPIVA and the Case for Indexing

What’s driving the rise of passive investing? Take a deep dive into the active vs. passive debate as S&P DJI’s Craig Lazzara explores what two decades of SPIVA has to say about why active has historically tended to underperform passive around the world.

The posts on this blog are opinions, not advice. Please read our Disclaimers.