Get Indexology® Blog updates via email.

In This List

Examining Equal Weight

Watch Your Weighting Scheme

A Weakening Aussie Dollar Puts Offshore Earners in the Spotlight

U.K. Bond Market: Insights from the Recent Downturn

Petroleum Helped the S&P GSCI Gain 6.7% in October

Examining Equal Weight

Contributor Image
Anu Ganti

U.S. Head of Index Investment Strategy

S&P Dow Jones Indices

In this tumultuous market characterized by Fed rate hikes, elevated inflation and a strong dollar, mega-cap growth companies have suffered heavy losses, paced by recent “Big Tech” earnings disappointments from Meta, Microsoft, Alphabet, Amazon and others. The S&P 500® Top 50 declined by 19% over the past 12 months, underperforming the S&P 500 by 5%. The unsurprising result is that S&P 500 Equal Weight Index, which by definition is underweight these mega-cap names, has outperformed. Exhibit 1 shows that the equal weight index beat the S&P 500 by 5% in the 12-month period ending October 2022.

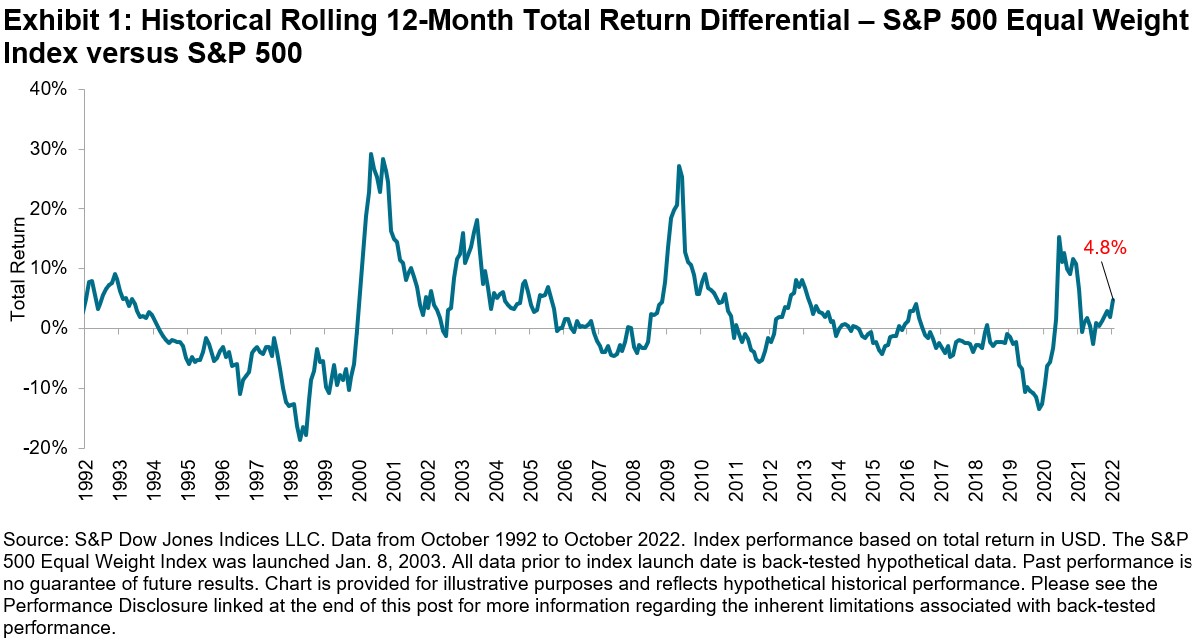
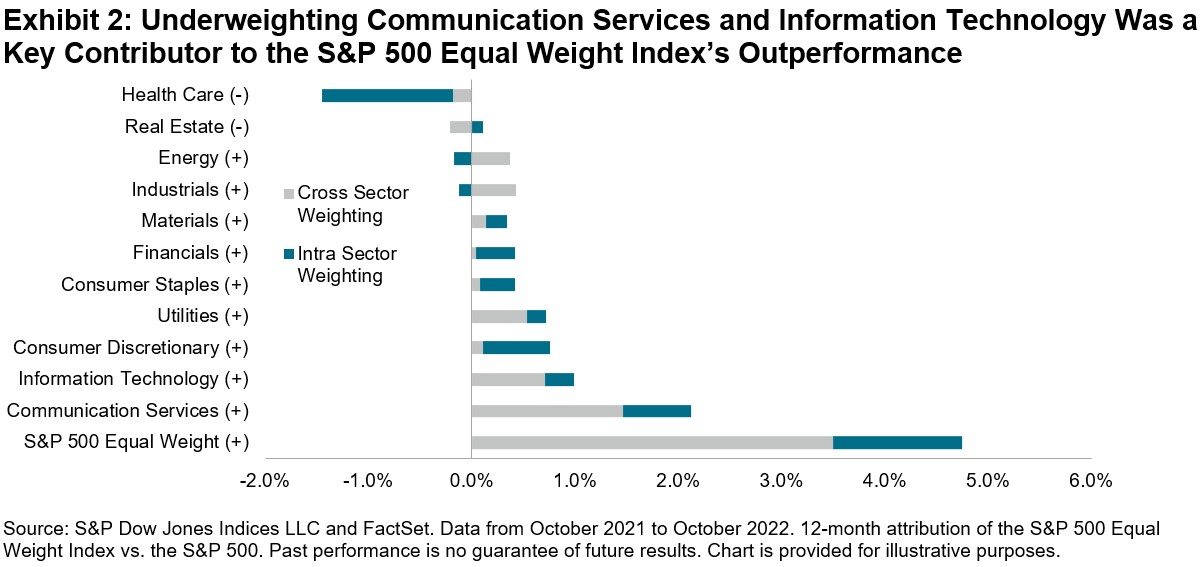
Exhibit 2 shows that the S&P 500 Equal Weight Index’s underweight to Communication Services and Information Technology, sectors that posted substantial losses so far this year, was a key contributor to the index’s recovery.

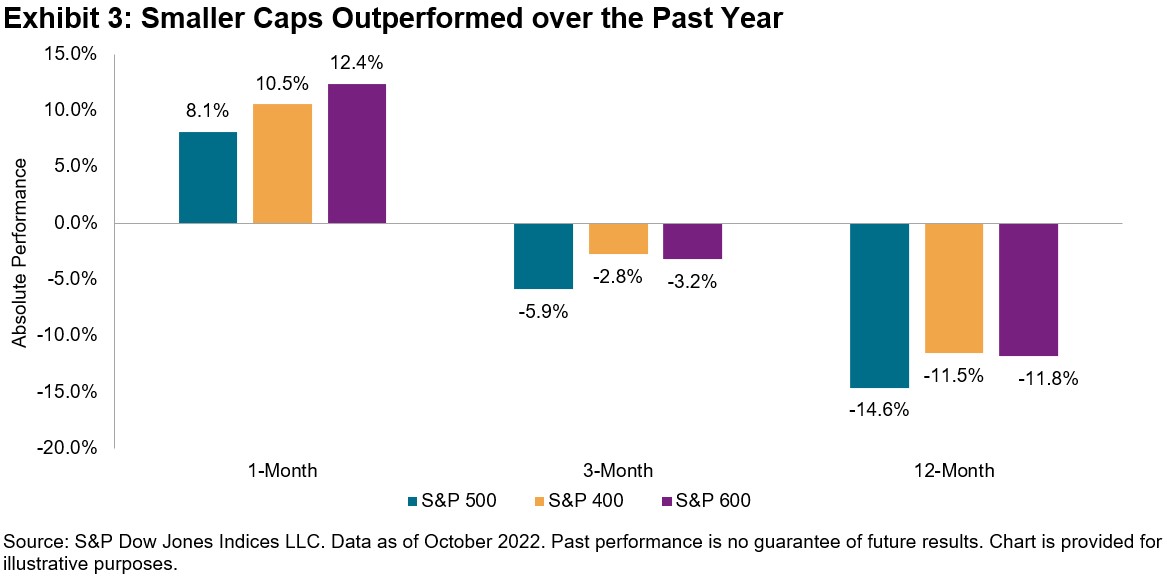
In addition to favorable sector exposures, the importance of which my colleague discusses here, the S&P 500 Equal Weight Index’s inherent factor tilts have proven beneficial as well. The strategy’s small-cap bias has been a tailwind, since smaller-cap companies, whose revenues are more domestically generated, have been less vulnerable to the macro headwind of a stronger U.S. dollar. Exhibit 3 illustrates the recent strong outperformance of the S&P 400® and the S&P 600® relative to their large-cap counterpart.

The S&P 500 Equal Weight Index’s anti-momentum bias, the product of selling relative winners and purchasing relative losers at each rebalance, has aided outperformance as a result of the momentum factor’s weakness for most of this year. The strategy’s implicit value bias has also been a source of outperformance, given the strong turnaround in the performance of value strategies this year.

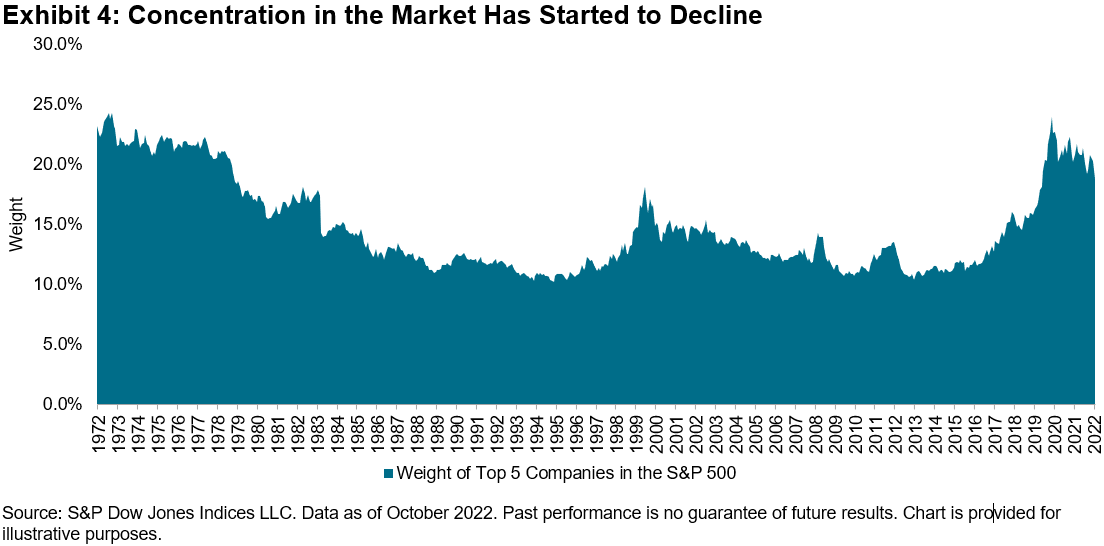
A natural outcome of the outperformance of the S&P 500 Equal Weight Index is that concentration levels in the market have begun to decline, as we observe in Exhibit 4. This is not surprising given the inverse relationship between concentration and equal weighting.


The posts on this blog are opinions, not advice. Please read our Disclaimers.

Watch Your Weighting Scheme

Contributor Image
Hamish Preston

Head of U.S. Equities

S&P Dow Jones Indices

2022 has witnessed a recalibration across financial markets, as investors have digested the impact of higher interest rates amid elevated inflation. Despite bouts of optimism that the U.S. Federal Reserve would take a more dovish stance, and better-than-expected corporate earnings, Exhibit 1 shows that the vast majority of large-, mid- and small-cap indices declined through the end of October.

However, not all market segments reacted the same way to this year’s news flow. Indeed, Exhibit 2 shows that the 108% YTD spread between Energy (69%) and Communication Services (-39%) is the highest spread between the best- and worst-performing S&P 500® sectors in the first 10 months of any year since 1990. Energy companies benefitted from increasing commodity prices, while some of the largest growth-oriented Communication Services companies came under particular pressure amid interest rate hikes.

Unsurprisingly, perhaps, sector allocations have been unusually important in explaining this year’s relative returns. One way to see this is by examining the S&P 500 Equal Weight Index and the S&P 500. Exhibit 3 shows that the equal-weight index outperformed in the first 10 months of 2022, as it has done in most years since 1970, and that its 4.8% outperformance in 2022 is the highest margin through the end of October in over a decade.

Although outperformance in equal-weight indices has typically been driven by equally weighting within each sector, Exhibit 4 shows that the S&P 500 Equal Weight Index particularly benefitted this year from its lower exposure to Information Technology and Communication Services (which underperformed), and its higher exposure to Energy and Industrials (which outperformed).

2022’s challenging environment has left few places for investors to hide, but the varying impacts of news flow on market segments contributed to record-breaking sector spreads. The impact of different weighting schemes on sector exposures, and the resulting impact on index performance, means that market participants may wish to watch their weighting scheme.

The posts on this blog are opinions, not advice. Please read our Disclaimers.

A Weakening Aussie Dollar Puts Offshore Earners in the Spotlight

Contributor Image
Sean Freer

Director, Global Equity Indices

S&P Dow Jones Indices

The days of Australian-U.S. dollar parity are becoming a distant memory, as U.S. dollar strength has seen the value of the Australian equivalent reach a recent low of just under 63 cents, a decline of over 13% from year-end levels.

The weakening of the Australian dollar could have significant implications for the share prices of companies within the S&P/ASX 200. While there are many idiosyncratic reasons for each company to thrive or struggle in the current economic environment, those with more earnings exposure to foreign markets may be at an advantage due to the increased value of their earnings when translated back into a weaker Australian dollar.

The S&P/ASX 200 Geographic Revenue Exposure Indices offer insight into the performance of Australian companies in periods of domestic currency strength and weakness. The S&P/ASX 200 Australia Revenue Exposure Index includes companies from the S&P/ASX 200 that have greater-than-average revenue exposure to Australia (compared to the benchmark).  Conversely, the S&P/ASX 200 Foreign Revenue Exposure Index includes companies with greater-than-average exposure to markets outside Australia. The indices are weighted by float market cap.1

Before looking at performance, it’s important to see the makeup of each index relative to the broader market. As of Oct. 30, 2022, the S&P/ASX 200 Foreign Revenue Exposure Index was overweight in the Materials, Health Care and Information Technology sectors, while the S&P/ASX 200 Australia Revenue Exposure Index was tilted toward the Financials, Real Estate, Communication Services and Consumer sectors (see Exhibit 1).

When looking at performance periods ending Oct. 31, 2022, the S&P/ASX 200 Foreign Revenue Exposure Index slightly underperformed YTD, with Information Technology companies notably weighing down performance (see Exhibit 2). However, the index outperformed over longer-term periods, with the aforementioned overweight sectors (Materials, Health Care and Information Technology) driving the stronger returns.

Exhibit 2 tracks performance to one point in time only.  If we review rolling three-year periods, we can see more clearly times when companies with greater domestic revenue exposure outperformed and vice versa. When overlaying the 36 rolling month-end averages of the currency spot rate, a trend emerges. Since the Australian dollar dropped below 80 cents to a U.S. dollar, the S&P/ASX 200 Foreign Revenue Exposure Index consistently outperformed the S&P/ASX 200 Australia Revenue Exposure Index by more than 5% per year over rolling three-year periods.

As highlighted by the S&P/ASX Geographic Revenue Exposure Indices, exchange rate movements can have a meaningful impact on underlying Australian equity market performance. S&P/ASX 200 companies deriving greater revenue from foreign sources have typically outperformed the broad market during periods of Australian dollar weakness and underperformed during periods of strength.

1 Please refer to the methodology document for S&P Global Revenue Exposure Indices for more information: https://www.spglobal.com/spdji/en/documents/methodologies/methodology-sp-global-revenue-exposure-indices.pdf.

The posts on this blog are opinions, not advice. Please read our Disclaimers.

U.K. Bond Market: Insights from the Recent Downturn

Contributor Image
Paulina Lichwa-Garcia

Associate Director, Fixed Income Indices

S&P Dow Jones Indices

The past few weeks have been extraordinary as U.K. politics and financial markets entangled, resulting in GBP-denominated debt becoming both shaken and stirred.

Gilts, bonds issued by the U.K. government, were hit particularly hard on the back of collateral calls in the liability-driven investment pension crisis. Gilts saw their yields reach multi-year highs, especially in the long duration segment.

As Rishi Sunak took over as Prime Minister at the end of October, some calm returned, after the bond vigilantes’ spell. While the new government focuses on sending a message of stability, for the GBP bond market, there is more of an afterthought to look at. Gilts’ reputation as safe-haven instruments has been hurt, but for the British pound sterling bond market, questions arise about what potential opportunities are out there for fixed income investors and how they compare to other markets.

Taking a step back and looking at the broad fixed income category, the global bond market has been having a tough year. The longer duration segment, which has been hit hard in the recent volatile market environment in the U.K. and globally, has seen the biggest losses due to rising interest rates. Exhibit 1 shows the YTD performance of the iBoxx £ Overall in different maturity buckets since the start of the year.

Exhibit 2 shows the daily YTD return of the broader GBP debt market over more than 20 years. The performance in 2022 clearly stands out even before the political and financial volatility in October.

We compared these results with the EUR- and USD-denominated debt markets, and they followed a similar trend. The difference, of course, is in the magnitude of these slumps. While iBoxx £ Overall YTD returns were at their lowest in mid-October, at -29.81% on Oct. 12, 2022, the iBoxx $ Overall declined about 16%, while the iBoxx € Overall shed about 17% over the same period. The energy crisis and hard-to-tame inflation have been key contributors to these declines, as central banks around the world have embarked on hiking interest rates.

The annual yields on the iBoxx £ Gilts spiked considerably amid the post-mini budget crisis, compared to the iBoxx Global Government Index, a basket of debt from developed markets. At their peak, U.K. gilt yields also outpaced those of Italy’s bond market, which posted multi-year highs after the country’s September elections. Amid the rally, the U.K.’s cost of debt narrowed its spread considerably even compared to emerging market yields on Oct. 12, 2022. Exhibits 5 and 6 are reminders of the respective duration and credit quality of these indices.

The past weeks have seen the GBP bond market move into new territories. As the shockwaves of these events are being digested, the fixed income market will no doubt stay vigilant of signs of cracks in other bond markets, as well as potential opportunities brought on by this market rout.

The posts on this blog are opinions, not advice. Please read our Disclaimers.

Petroleum Helped the S&P GSCI Gain 6.7% in October

Contributor Image
Jim Wiederhold

Former Director, Commodities and Real Assets

S&P Dow Jones Indices

Commodities, represented by the broad-based S&P GSCI, rose 6.7% in October on the back of strength in the petroleum complex. During the month, the director of the International Energy Agency said the world is in the middle of “the first truly global energy crisis.” All petroleum constituents rose by double-digit percentage points. Livestock also rose, while agriculture, industrial metals and precious metals were flat or down.

The S&P GSCI Heating Oil was the hottest energy commodity, rising 23.56% last month. Backwardated futures curves across energy commodities continued to be one of the major tailwinds behind the strength of the market. U.S. President Biden threatened to raise taxes on oil companies if they do not work to lower gasoline prices by increasing production. The president of the American Petroleum Institute stated, “increasing taxes on American energy discourages investment in new production, which is the exact opposite of what is needed.”

The S&P GSCI Agriculture was a mixed bag of grains in October. The S&P GSCI Corn rose 2.39% and the S&P GSCI Soybeans rose 3.52%, while the S&P GSCI Wheat fell 3.96%—all of which were slight reversals compared to the prior month. The wheat market continued to gyrate in tandem with news surrounding the Ukraine-Russia grain deal. Lower projected corn and soybean yields in the U.S. increased bullishness in those grains when the World Agricultural Supply and Demand Estimates (WASDE) was released mid-month.

Industrial metals posted mixed performance in October. In particular, the slowdown of the Chinese economy has negatively affected metals. The only industrial metal without double-digit YTD underperformance was the S&P GSCI Nickel, which was up 5.79% YTD, but well off the highs from the start of the Ukraine-Russia conflict. That said, both the S&P GSCI Nickel and S&P GSCI Aluminum rose 3.4% for the month. These two industrial metals make up a combined 50% of the current metal cost in an average electric vehicle, according to S&P Global Commodity Insights’ latest biannual research.

The S&P GSCI Gold fell for the second month in a row, off 1.56% in October, as the U.S. Fed continued to hike rates to fight inflation. A hawkish monetary policy is the enemy of a non-yielding asset such as gold.

The S&P GSCI Lean Hogs rose 11.76% in October. Prior to this month, it was roughly flat for the year. This increase is an outlier compared to the usual seasonal lows seen historically in October. A surge in pork belly prices has helped drive performance, although ample supplies may lower enthusiasm in the market for the rest of the year.

To learn more about the S&P GSCI and related indices, check out our Commodities Theme Page.

The posts on this blog are opinions, not advice. Please read our Disclaimers.