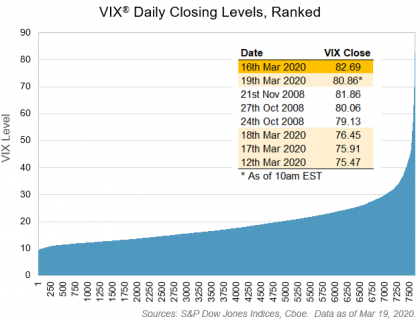
Recent selloffs in the equity markets and a significant rise in volatility signal an end to the 11-year bull market (Bye Bye Bull Market: Reaction to Coronavirus). While most broad market domestic equity indices have declined, the performance of the S&P MARC 5% Index (ER) has held up (1.84%). The answer to its resiliency lies in its index construction, which attempts to maximize diversification benefits.
As the name implies, the index allocates the weight across multiple asset classes: the S&P 500® (ER), S&P 10-Year U.S. Treasury Note Futures Index (ER), and the S&P GSCI Gold (ER). Exhibit 1 shows the year-to-date performance of the S&P MARC 5% Index against its underlying components. Looking at the performance of the underlying assets, we can see that the index benefited from positive performance by the S&P 10-Year U.S. Treasury Note Futures Index (5.90%) and less negative performance by the S&P GSCI Gold (-0.27%).

Next, we look to see if asset class diversification provided similar benefits historically. Exhibit 2 shows the historical breakdown of asset classes during the past 12 months. We see that the index performance was driven primarily by higher allocations to fixed income and commodities. On average, the highest allocation was to fixed income, at 67.6%, followed by gold (26.2%) and equities (23.7%). The S&P MARC 5% Index was over 100% allocated to its underlying assets for approximately 91% of the period studied. There were only a few instances when the allocation dropped below 100%, the most recent one occurring last week, with the index allocating to its underlying assets rather than to cash.

Year-to-date, we see that the S&P MARC 5% Index (ER) typically had smaller drawdowns relative to its underlying asset classes (see Exhibit 3). The maximum drawdown from Jan. 1, 2020, to March 17, 2020, of the index was -3.3%. It is quite evident that higher allocations to Treasuries and gold mitigated the large movements in the equity sleeve. The S&P 10-Year U.S. Treasury Note Futures Index (ER) and S&P GSCI Gold (ER) were steadier, with drawdowns of -2.6% and -11.4%, respectively. Meanwhile, the S&P 500 (ER) saw more drastic movements, with a maximum drawdown of -29.5% for the period studied.

The performance of the S&P MARC 5% Index (ER) during the recent drawdown demonstrates the benefits of portfolio diversification. With the index allocating across multiple asset classes, returns were more stable with smaller drawdowns, especially during times of high volatility.
The posts on this blog are opinions, not advice. Please read our Disclaimers.