Get Indexology® Blog updates via email.

In This List

Equity Liquidity at a Reasonable Price

Low Volatility in Europe and Asia

The Best Offense Is Defense – Why VEQTOR Outperformed Last Week

The VIX Futures Curve Is in Backwardation

The Darkest Hour

Equity Liquidity at a Reasonable Price

Contributor Image
Craig Lazzara

Former Managing Director, Index Investment Strategy

S&P Dow Jones Indices

The fall in equity market values since February’s peak has been sudden and dramatic.  During this period, the equity markets have functioned well at their primary task of facilitating price discovery at a time when values were changing rapidly.  Equity investors who wanted to trade have been able to trade.  (Whether they were wise to do so is a separate question.)

This is in no small part due to the liquidity provided by index-linked vehicles.  Index funds have been part of the investment landscape for nearly 50 years, during which time superior performance and low cost have earned them a growing share of investor assets.  What’s less well-appreciated has been the growth of a trading ecosystem linked to indices, most importantly to the S&P 500.  The vast majority of trading in index-linked vehicles is not done by index funds, but rather by active investors and traders.

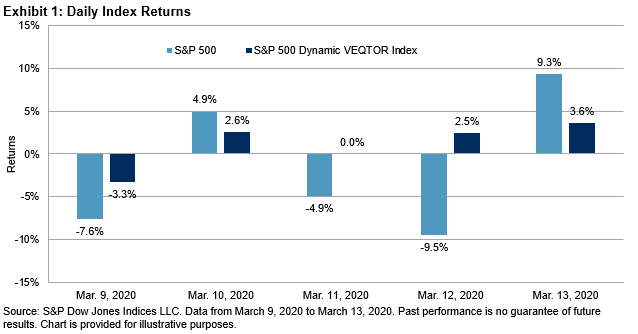
The coronavirus-induced bear market which we’re now enduring illustrates the logic of index-linked trading well.  A pandemic of still-unknown duration and severity can be expected to affect every business adversely.  The degree of adversity will obviously vary across industries, with some (e.g., airlines and hotels) suffering more than others.  But investors who want to adjust equity exposures quickly will be far better served by trading an entire index than by trying to sort out relative winners and losers in the traditional way.

In this environment, it’s unsurprising to see higher volumes and higher dealer spreads, as we did during the last two weeks’ market carnage.  It’s estimated that in the first week of March, “exchange-traded products powered more than a third of equities trading on U.S. exchanges.”  We can see this effect in Exhibit 1, which measures the average value traded in the largest ETF tracking the S&P 500.  Normally the most heavily-traded issue in the U.S. market, daily volume skyrocketed at the end of February.

Exhibit 1. Trading Volume Spiked During the Market Decline

Source: S&P Dow Jones Indices, Bloomberg. Data from Jan. 3, 2012 to March 16, 2020. Graph is provided for illustrative purposes.

At the same time trading costs rose, as measured by the width of the bid-offer spread pictured in Exhibit 2.

Exhibit 2.  Spreads Widened

Source: S&P Dow Jones Indices, Bloomberg. Data from Jan. 3, 2012 to March 16, 2020. Graph is provided for illustrative purposes.

As recently as January 2020, spreads were as low as 0.003%; more recently they doubled.  Spreads are not at all-time highs, however, and trading the ETF is still much cheaper than trading individual securities.

It’s important to understand that the widening of dealer spreads is a natural and appropriate reaction to the extraordinary levels of market volatility we’ve witnessed since mid-February.  Exhibit 3 describes the relationship between the VIX index and the ETF’s bid-asked spread.  When VIX is at or below its median level, for example, spreads average just over $0.01/share.  The relationship slopes gently upward over most values of VIX.  Extreme levels of VIX, however, indicate heightened dealer risk, and thus increased bid-asked spreads.

Exhibit 3.  Higher VIX Leads to Wider Spreads

Source: S&P Dow Jones Indices, Bloomberg. Data from Jan. 3, 2012 to March 16, 2020. Graph is provided for illustrative purposes.

At time when it was badly needed, index-based products helped to ensure equity liquidity was available at a reasonable price.

The posts on this blog are opinions, not advice. Please read our Disclaimers.

Low Volatility in Europe and Asia

Contributor Image
Fei Mei Chan

Former Director, Core Product Management

S&P Dow Jones Indices

“The rich, the poor, the high, the low
Alike the various symptoms know”–The Influenza
Winston Churchill, 1890

By this point, the infamous COVID-19 has made its way around the world and wreaked havoc through equity markets across the globe. We’ve already highlighted the value of protection in the U.S. and Canada.  Pandemics show no respect for international boundaries, so year to date charts for equity indices everywhere show very similar patterns and conclude with the same trajectory. Everyone started 2020 on a good note until the reality of the virus settled in.

We often say that the low volatility anomaly is universal, but it is rare that we see the strategy at work simultaneously in multiple markets.  The charts on the left below track year to date performance for the parent index in each region and the respective low volatility index. On the right shows the performance from the beginning of the year to the peak for each region and then the performance from the peak through March 16. In every market, the low volatility strategy has allowed for participation on the way up while offering protection on the way down.

The posts on this blog are opinions, not advice. Please read our Disclaimers.

The Best Offense Is Defense – Why VEQTOR Outperformed Last Week

Contributor Image
Berlinda Liu

Former Director, Multi-Asset Indices

S&P Dow Jones Indices

Six minutes after trading began on the New York Stock Exchange on March 9, 2020, the S&P 500® plummeted 7% and market-wide circuit breakers kicked in for the first time since the stock market crash of Oct. 27, 1997. However, the indices fell again later in the week and triggered another circuit breaker on Thursday, March 12. As I was writing this blog, on Monday, March 16, the third circuit breaker rocked the market soon after the open.

In such a tumultuous market, the best way to win is to not lose. The S&P 500 Dynamic VEQTOR Index was among the few strategies that posted positive returns in the week of March 9, 2020; it gained 5.3% in one of the worst weeks in S&P 500 history (-8.7%).

Although the VEQTOR index lagged the broad market most of the time in 2020 before last week, it finally pulled ahead with its recent success. Exhibit 2 shows how dramatic the reversal of fortune has been. As of March 13, 2020, the S&P 500 lost 15.7% YTD with a volatility of 45.5%, while the S&P 500 Dynamic VEQTOR Index gained 4.2% YTD with a volatility of 16.2%.

The outperformance of the VEQTOR strategy mainly comes from its dynamic allocation to the S&P 500 VIX® Short Term Futures Index, a liquid, tradable proxy of VIX spot. This defensive strategy index monitors the implied and realized volatility in the market and allocates to equity and VIX futures accordingly. Its allocation to VIX futures usually increases in a volatile market and decreases otherwise. In the calm market of January 2020 when VIX was below 15 on most days, VEQTOR maintained a low allocation of 2.5% to VIX futures. However, as VIX shot up more than 300% in March 2020, VEQTOR quickly increased its allocation to VIX futures to 40%. We also observed that VEQTOR took precaution and went to all cash briefly when the index dropped more than 2% in the course of one week (see Exhibit 3).

Historical data shows that both VIX spot and VIX futures tend to have a negative correlation with the equity market, and this correlation is generally strengthened during market crisis, when traditional geographical hedging and cross-asset-class hedging breaks down. Furthermore, the negative correlation between VIX spot and futures and the equity market is convex. This means that when the S&P 500 drops, VIX spot and futures tend to rise even higher. The combination of negative correlation to the equity market and convexity of VIX futures contribute to the recent success of the VEQTOR strategy with an allocation to VIX of less than 50%.

That said, investors must keep in mind that the VEQTOR strategy is designed to hedge tail risk in the broad equities market. Similar to holding a continuously rolling put option, hedging costs over time tend to create a significant performance drag in the long term. As shown in Exhibit 4, the S&P 500 Dynamic VEQTOR Index lagged the S&P 500 in the past decade’s bull market. In general, the index tends to outperform when VIX rises and stays high for a prolonged period.

The famous football saying, “the best offense is a good defense” is true because a good defense means that you are always in the game. The S&P 500 Dynamic VEQTOR Index has lagged the broad equity market in the long stretch of the 10-year bull market. In the recent market shakeup, however, investors who opted for its defensive feature are getting what they paid for.

If you are interested in the S&P 500 Dynamic VEQTOR Index allocation process, please refer to its methodology and our Research paper: Dynamically Hedging Equity Market Tail Risk Using VEQTOR.


The posts on this blog are opinions, not advice. Please read our Disclaimers.

The VIX Futures Curve Is in Backwardation

Contributor Image
Tianyin Cheng

Former Senior Director, ESG Indices

S&P Dow Jones Indices

Backwardation is incredibly uncommon in the VIX® futures curve. While the reason behind this term structure is not perfectly understood, the conclusion is clear: long and hold does not work for VIX futures, as the roll cost burns.

There are different ways to measure VIX futures backwardation: by using the relationship between the VIX level and the front-month futures, between the first and second month futures, or between points further out on the curve.

One way I think highly insightful is to calculate the roll yield by taking the return of the S&P 500® VIX Short-Term Futures ER MCAP Index (ER measures the price return plus the roll return) less the returns of the S&P 500 VIX Short-Term Futures Index (which measures the price return only). Backwardation was implied by a positive result, whereas contango was implied by a negative result. This approach also allows us to decompose the return of the S&P 500 VIX Short-Term Futures ER MCAP Index into the price change of VIX futures (at constant one-month maturity) and roll yield/cost.

Backwardation is incredibly uncommon in the VIX futures curve. Since 2005, there have only been four periods where the roll yield was wider than 1%—during the financial crisis, when the U.S. lost its ‘AAA’ credit rating in 2011, in February 2018, and now.

The implication of this is that when VIX futures are backwardated, exchange-traded products that track the S&P 500 VIX Short-Term Futures ER MCAP Index may earn a positive return from rolling into a cheaper contract before expiry, independently from the futures price change. Thus if the VIX level is unchanged, the index can still provide positive returns through the roll yield. For example, this roll yield averaged 1.2% per day last week (March 9-13, 2020).

We know backwardation is an uncommon occurrence, and Exhibit 3 provides some historical context of how long backwardation has lasted in prior periods.

Note the longest streaks in Exhibit 3 were 76 and 63 days and they occurred in 2011 and 2008, respectively. During both periods, roll yield contributed 115% and 45% to the S&P 500 VIX Short-Term Futures ER MCAP Index, respectively.

We have been in backwardation for three weeks (as of March 13, 2020), and VIX is approaching an all-time high; if the markets continue to be volatile, we could be in this situation for some time.

The posts on this blog are opinions, not advice. Please read our Disclaimers.

The Darkest Hour

Contributor Image
Chris Bennett

Former Director, Index Investment Strategy

S&P Dow Jones Indices

It is always darkest just before the Day dawneth

-Thomas Fuller

The bull market is over.  After 11 years of impressive and relatively steady gains, last week the S&P 500® slid into bear market territory, marking the end of the glory of the 2010s and the start of a new regime.  Volatility is back with a vengeance, and safe haven assets are now the belles of the ball.  But what does this mean for markets? Should we panic yet? The short answer is: probably not.

While there have been many painful market declines, including the 2000-2002 bursting of the tech bubble, the 2008 financial crisis, and the current coronavirus-driven sell-off, the historical market trend has been strongly positive.  Since 1950, there have been very few periods during which the S&P 500 has been down over a five-year period, and even fewer over ten-year periods, as shown in Exhibit 1.

This isn’t too much of a leap given what we know:  The S&P 500 today is higher than when it was launched, and the long-run trend will likely remain positive.  Short-term sentiment may shift day to day or even hour to hour depending on a variety of factors, but the market has historically risen more often and to a greater extent than it has declined.   What this means is that bad days or volatile periods tend to be temporary dislocations rather than sea changes.  After major drops, the S&P 500 typically rebounds.  If we take, for example, the 10 worst daily declines in the S&P 500 dating back to the 1951 Fed-Treasury accord, as shown in Exhibit 2, we see that the index has recovered from most major drops within a year.  Even when the recovery took a bit longer, the damage eventually became history.

Of course, past performance is no guarantee of future results. Our intent is not to call a market bottom or to predict short-term movements, but rather to highlight what history tells us: the market tends to recover.  Unless there is an absolute need for immediate liquidity, riding out the storm has generally been a better decision than running away at the start of a panic.  In fact, many of the best days in the market have followed the worst ones.  The only way to capture these rebounds is to be in the market.  While timing the recovery is a fool’s errand, betting that there will be one is a fairly safe wager.  Consider that before you take your chips off the table.

The posts on this blog are opinions, not advice. Please read our Disclaimers.