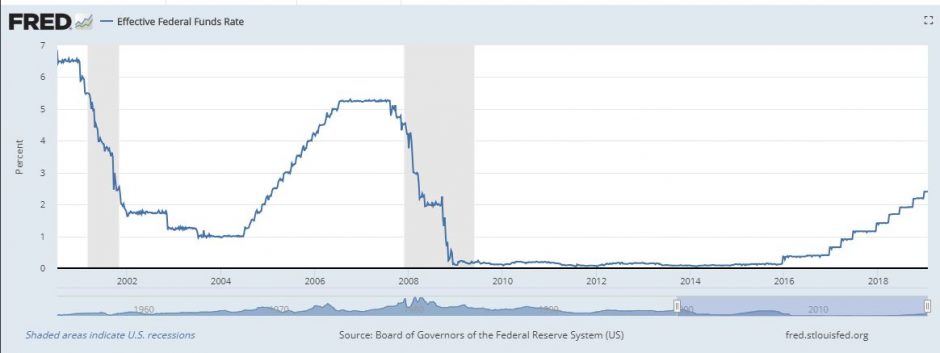
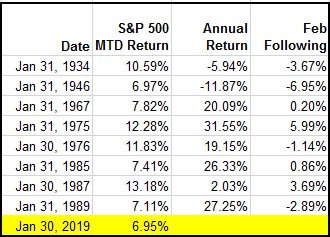
In the first seven trading days of 2019, the S&P 500 had its hottest start since 2003. That happened following the Fed’s message that it was in no hurry to raise interest rates. The Fed met again yesterday signaling it might end the interest rate increases, which pushed the S&P 500 up 1.55% for the day (Jan. 30, 2019). This has put the S&P 500 on track to post its 9th best January on record since 1928, its best January since 1989, and its best month since October 2015 with a gain of 6.95% through Jan. 30, 2019. In the years including the prior 8 top Januaries, the S&P 500 finished positively 6 times, of which 5 years had gains over 19%. However, the subsequent Februaries were only positive half the time with biggest gain of 5.99% in February 1975.
The S&P 500 had a notable turnaround in January after posting its second worst December on record. While there were, and still are some major global uncertainties – both domestically and internationally – it seems like the market was being mainly driven by the Fed. It wasn’t just the S&P 500 but was the entire U.S. equity stock market that was impacted. All 42 segments of size, style and sector were positive, which has happened in just 11 prior months, last in March 2016.
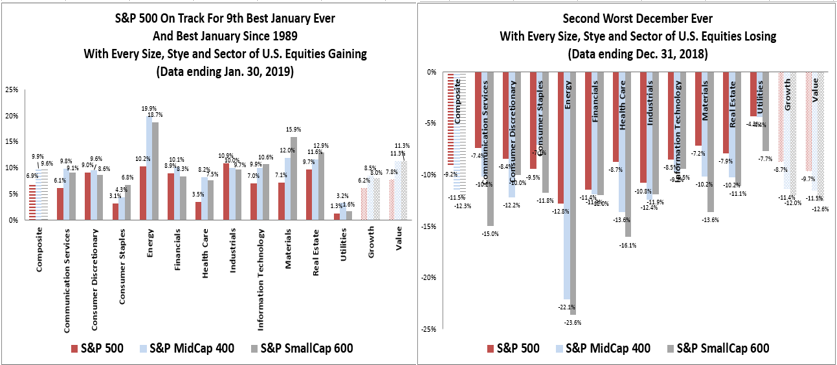
Half of the 42 segments of the U.S. equity market are on pace to post their best January on record, using data starting Sep. 1989, the earliest available sector data. Also, some sectors are on pace to post relatively strong record months, for example, the S&P 600 Real Estate and the S&P MidCap 400 Value are each targeting their 4th best month ever, with respective gains of 12.88% and 11.30%. The S&P MidCap 400 gained 9.87% and S&P SmallCap 600 9.63%, both posting their best Januaries and beating the S&P 500, as they historically have in rebounds. Energy was the best performing sector, and unsurprisingly (due to hedging,) large caps (+10.24%) lagged the smaller company performance (+18.67%) as oil rose from sanctions on Venezuela and supply cuts from Saudi Arabia.
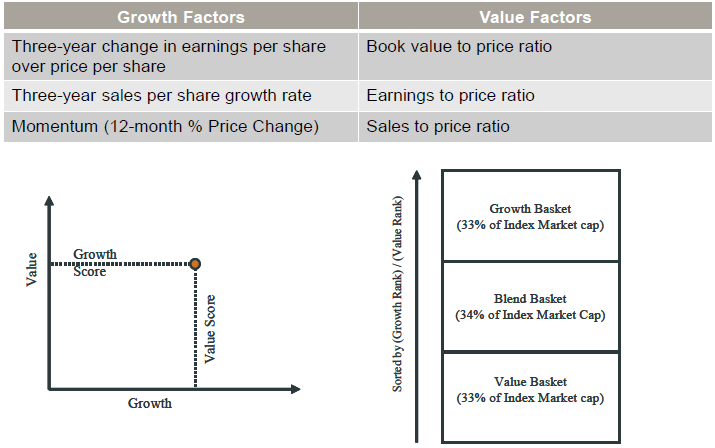
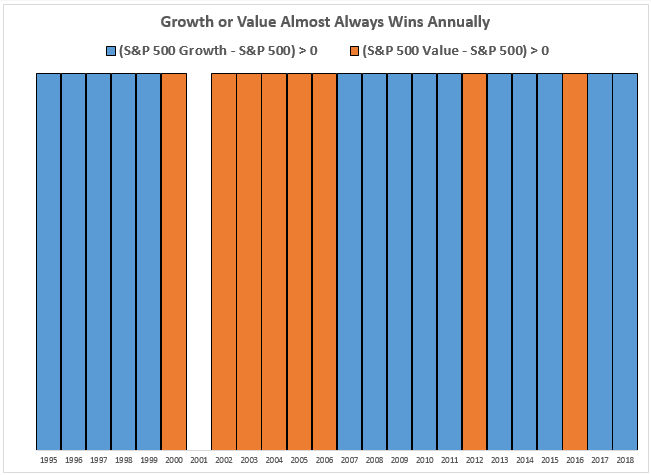
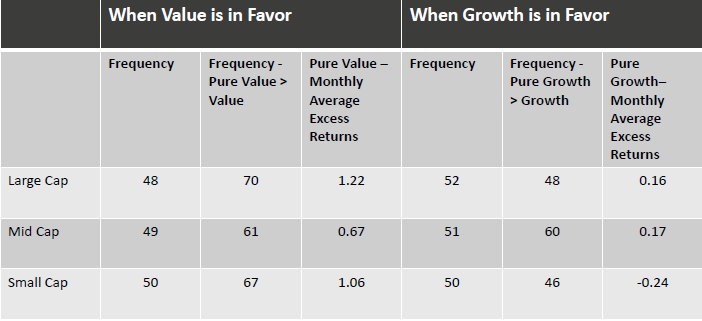
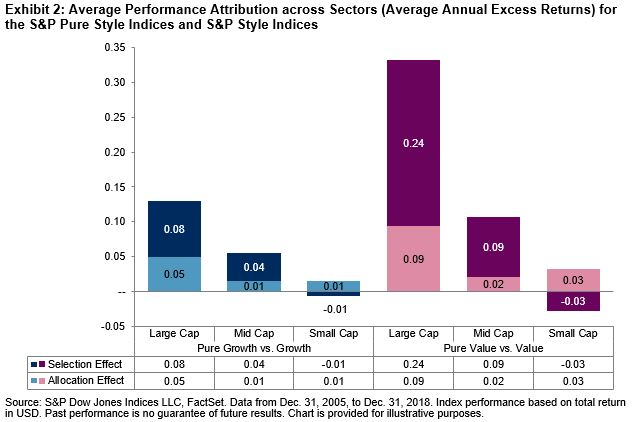
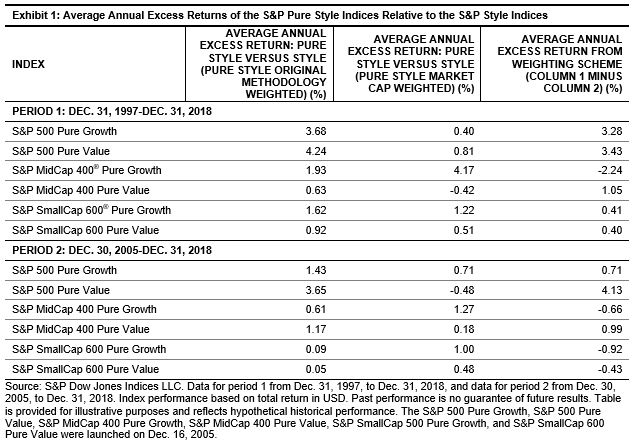
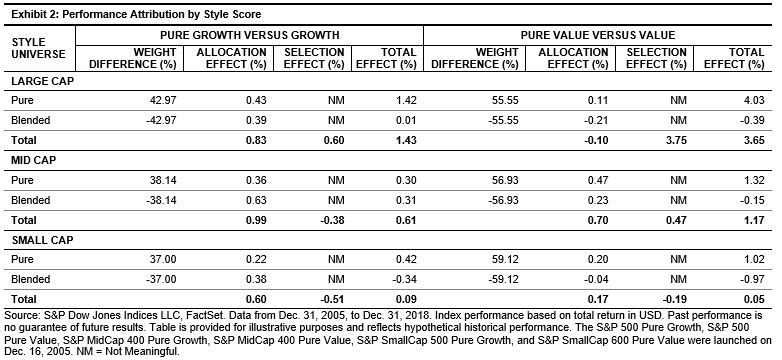
Lastly, value outperformed growth significantly, especially in small-cap and mid-cap segments. While the S&P 500 Value only outperformed the S&P 500 Growth by 1.63% in January, the S&P MidCap 400 Value outperformed the S&P Midcap 400 Growth by 2.77%, the most since the 4.18% outperformance in November 2016. Moreover, the S&P SmallCap 600 Value outperformed the S&P SmallCap 600 Growth by 3.28%, the most since 4.27% of value outperformance in February 2001, and the 10th biggest outperformance on record.
The posts on this blog are opinions, not advice. Please read our Disclaimers.