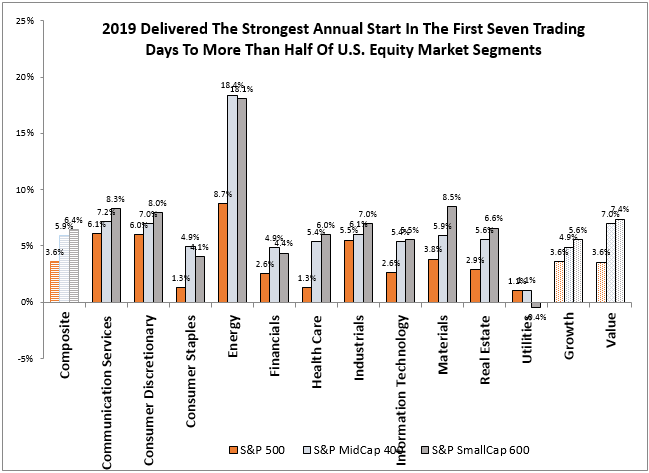
Style investing as an investment approach has long been utilized by market participants to group securities based on their common characteristics and risk/return drivers. Those common characteristics, in turn, help investors make strategic and tactical asset allocation decisions.
The first-generation S&P U.S. Style Indices serve as effective underlying tools for market participants seeking a passive investment vehicle or benchmarks measuring active style portfolios. Covering broad market segments, the indices group the universe into value and growth categories using style metrics commonly used in the investment community.
Certain securities may exhibit both growth and value characteristics: in this scenario, the company’s market capitalization is distributed between growth and value indices. This makes the indices suitable for those seeking a traditional “buy and hold” index-linked investment implementation with a tilt toward a particular style.
A side effect of this is that there are overlapping securities that fall into both growth and value indices. This mixed basket approach may not appeal to market participants that desire more precise and focused measurement tools.
The S&P Pure Style Indices were created with a stricter definition of style factors, resulting in a clearer differentiation between growth and value. The two approaches to differentiating between value and growth are highlighted in Exhibit 1 using the S&P 500® and the large-cap style (S&P 500 Value and S&P 500 Growth) and pure style indices (S&P 500 Pure Value and S&P 500 Pure Growth) as an example.
 The S&P Pure Style Indices include only securities that exhibit either pure growth or pure value characteristics. Due to this, there are no overlapping securities between the pure growth and pure value indices. The concentrated exposures of the S&P Pure Style Indices potentially present them as better candidates for market participants looking to have precise tools in their investment process.
These differences drive the long-term performance differential between the two sets of indices, giving rise to distinct risk/return profiles. We report the risk/return differences between the style and pure style indices in Exhibits 2 and 3. For comparison purposes, we include the Russell Style indices, given that market participants also benchmark to those indices.
The pure style indices had higher average returns than the style indices; however, they also exhibited higher volatility, evidenced by the average annual volatility figures. The return/risk ratio shows that pure style displayed mixed performance results depending on the market-cap size, style orientation, and measurement period.
Both style and pure style indices use the same fundamental metrics to calculate style scores and to group securities into value and growth categories. Additionally, the pure style indices use style scores to determine constituent weights. Therefore, we expect the pure style indices to have stronger value or growth characteristics than their style peers. Exhibit 4 shows the annual averages of these ratios, which mostly line up with our expectations.
Across all size segments, the pure value indices historically had more attractive, or lower, price multiples than both the value indices and the underlying benchmarks. Interestingly, the pure growth indices tended to have lower valuation multiples than their traditional growth counterparts. A potential cause may be due to the higher sales and earnings growth rates of the pure growth indices versus the growth indices, outweighing the price difference.
For a deeper dive into the next generation of style indices, tune into our webinar at 2pm EST tomorrow: Sizing Up Your Style Strategies.
The posts on this blog are opinions, not advice. Please read our Disclaimers.