Get Indexology® Blog updates via email.

In This List

Looking Through The Sector Lens

Playing Defense and Offense With Factor Strategies

Every Country's Stock Market Loses From Trade Tensions

Breaking Down Volatility

Momentum Bubble Deflating?

Looking Through The Sector Lens

Contributor Image
Anu Ganti

U.S. Head of Index Investment Strategy

S&P Dow Jones Indices

We’ve recently noted that this month’s market turmoil created a radical reversal of factor returns, poking holes in this year’s momentum bubble.

A similar trend has occurred within sectors.  During the first nine months of 2018, Consumer Discretionary and Info Tech dominated performance, as seen in Exhibit 1.

For the first two weeks of October, however, Exhibit 2 shows that defensive sectors such as Utilities and Consumer Staples outperformed former leaders such as Technology and Consumer Discretionary. The reversal of sectoral fortunes parallels the reversal in factor index performance.

As readers of our U.S. Sector Dashboard will realize, this is not coincidental.  Consumer Discretionary and Info Tech have a strong tilt to Momentum, while Utilities and Consumer Staples are tilted towards defensive factors such as Low Volatility and Value.

Sectors and factors interact in characteristic or typical ways. Investors can look at the world through either lens. Their perception of reality will be improved if they use both.

The posts on this blog are opinions, not advice. Please read our Disclaimers.

Playing Defense and Offense With Factor Strategies

Contributor Image
Aye Soe

Former Managing Director, Global Head of Core and Multi-Asset Product Management

S&P Dow Jones Indices

The domestic equity market, as measured by the S&P Composite 1500®, ended Q3 2018 with a gain of 10.47%. Over the past 10 years, the S&P Composite 1500 had annualized returns of 12.05%, showing an impressive bullish run since the 2008 Global Financial Crisis. Perhaps reflecting the market environment, growth-oriented investment styles, such as momentum and growth, have been the best-performing factors over the past 12 months. For example, the S&P 500® Momentum , S&P 500 Growth , and S&P 500 Pure Growth posted excess returns of 12.46%, 7.3%, and 3.14%, respectively, over the S&P 500 (17.91%).

Empirical evidence shows that factors tend to earn higher risk-adjusted returns than the broad market over a long-term investment horizon; however, their returns can be rather cyclical in near- to mid-term horizons. Much like asset classes, depending on the market environment, some factors outperform and some underperform for extended periods. Using annualized 1-, 3-, 5-, and 10-year returns of various factor strategies, Exhibit 1 highlights the cyclical nature of factor returns.

While factors returns are cyclical, it is still possible to establish a generalized pattern of returns through various market environments. Using the monthly returns from June 30, 1995, through Sept. 30, 2018, we compared large-cap value, quality, momentum, low volatility, and size (represented by the S&P 500 Equal Weight Index) strategies against the S&P 500 (see Exhibit 2). We computed their hit rate (in percentage) in up, down, and all market periods[1]. In addition, we calculated the average monthly excess returns of the factor strategies in those three periods.

We can see that in general, the momentum and quality factors did better than the benchmark in all market periods. In up markets, the quality, momentum, and size factors had above average hit rates (> 50%). In declining markets, factors such as quality and low volatility stand out clearly, with hit rates above 75%. In other words, out of the 280 months that we studied, the S&P 500 had negative returns in 94 months. Of those months, the S&P 500 Low Volatility Index and the S&P 500 Quality Index outperformed over 75% of the time.

In addition, average monthly excess return figures show the magnitude of out- and underperformance by factors in different market environments. In general, during up markets, excess monthly returns of factors such as low volatility, quality, and value tended to be negative. However, a different picture emerged when markets declined, with the low volatility and quality factors posting average monthly excess returns of 2.04% and 0.91%, respectively. Hence, factors such as quality and low volatility generally have defensive properties with asymmetric payoffs, especially for the latter.

Therefore, one can group factors into two camps—return enhancing and risk reducing—with both offering higher risk-adjusted returns than the market over the long run. The momentum factor can potentially offer higher returns than the market in an upward-trending market. Conversely, low volatility and quality offer a higher degree of downside protection while providing limited upside participation.

For more discussion on playing defense and offense with factors, tune into our webinar on Oct. 17, 2018. Please click here to register.

[1]   We define up market as months in which the S&P 500 has positive returns.  Similarly, we define down market as months in which the S&P 500 has negative returns.


The posts on this blog are opinions, not advice. Please read our Disclaimers.

Every Country's Stock Market Loses From Trade Tensions

Contributor Image
Jodie Gunzberg

Former Managing Director, Head of U.S. Equities

S&P Dow Jones Indices

The International Monetary Fund (IMF) recently released its World Economic Outlook, October 2018, with estimated global trade tension scenario impacts on GDP.  Overall, the IMF states that recent tariffs will hurt GDP and that additional tariffs will weaken it further.  In the long term, according to the IMF’s scenario analysis (on p. 21,) the U.S. GDP will be 0.9% lower and China’s GDP will be 0.6% lower as a result from the trade tensions.  However, in 2019, the disruption caused by an escalation of trade restrictions could be particularly large with GDP losses of more than 0.9% in the U.S. and over 1.6% in China.

Source: Source: IMF staff estimates. World Economic Outlook, October 2018: Challenges to Steady Growth; October 8, 2018. Page 40.  https://www.imf.org/~/media/Files/Publications/WEO/2018/October/English/main-report/Text.ashx?la=en

Based on the IMF estimates and the historical sensitivity of stock markets to GDP growth, if the trade tensions escalate, some countries may be impacted more than others.  This can be measured globally by starting with the total U.S. dollar market capitalization of the S&P Global BMI (Broad Market Index) by country.  The United States is the largest in the world, representing 53.5% of the total market cap worth $27.8 trillion as of Oct. 11, 2018.  South Korea is the smallest country of the top ten by size, and has an index weight of 1.7% that includes about $902 billion.  In total, the top ten biggest countries by market value include 86% of the world’s $52 trillion total market value.

Source: S&P Dow Jones Indices Data as of Oct. 11, 2018.

Next the historical sensitivities of each country’s stock market to GDP growth is measured.  For example, for every 1% of U.S. GDP growth, the U.S. stock market value increased 3.79% on average (using year over year data from 1993-2017.)  South Korea was most sensitive with a 9.35% stock market value increase on average per 1% of U.S. GDP growth, while Japan was least sensitive on average gaining just over 2% on average per 1% of U.S. GDP growth.  The greater the percentage of its output a country exports to the U.S., the bigger the influence U.S. GDP growth has on that country’s stock market since the U.S. growth is so heavily driven by consumer spending.  Overall, the stock market sensitivity was far greater to U.S. GDP growth than to China’s.

Source: S&P Dow Jones Indices. Data is year-over-year from 1993-2017 for all countries, except is from 1998 for South Korea and China, as well as the composites. The chart shows historical market capitalization change per each 1% of GDP growth.

After measuring the historical stock market sensitivity of the ten biggest countries in the S&P Global BMI to each U.S. and China GDP growth, the decreased GDP as estimated by the IMF can be applied as one possible scenario to understand how stock market values may be reduced.  In total, if the U.S. and China GDP were to drop in 2019 by 0.9% and 1.6%, respectively (as estimated in a five-layer simulation by the IMF,) the global stock market value may lose $2.17 trillion or 4.9% of its value from the top ten countries under this scenario.  A total market value loss of about $1.49 trillion and $687 billion, all else equal, may be attributed to the GDP reduction in the U.S. and China, respectively, in this case.  While the total dollar market value loss in the U.S. would be biggest with a magnitude of $1.39 trillion under this scenario, the greatest percentage declines in market value might impact South Korea and China more with respective 12.4% and 8.2% losses.

Source: S&P Dow Jones Indices.

The posts on this blog are opinions, not advice. Please read our Disclaimers.

Breaking Down Volatility

Contributor Image
Fei Mei Chan

Former Director, Core Product Management

S&P Dow Jones Indices

“Data! Data! Data!” he cried impatiently. “I can’t make bricks without clay.”

– Sherlock Holmes (in “The Adventure of the Copper Beeches”)

Despite yesterday’s hand wringing loss for equity markets— the S&P 500 dropped 3.3%—the index is still up 5.8% year to date 2018. Nevertheless, losing in one day a third of what the equity market achieved in 9 months can, justifiably, cause alarm. In the not too distant past, the market experienced a similar trauma. Then, as now, volatility ticked up. But we also pointed out that in the broader context, the volatility jump in February 2018 was not too significant. Yesterday’s increase was even less so.

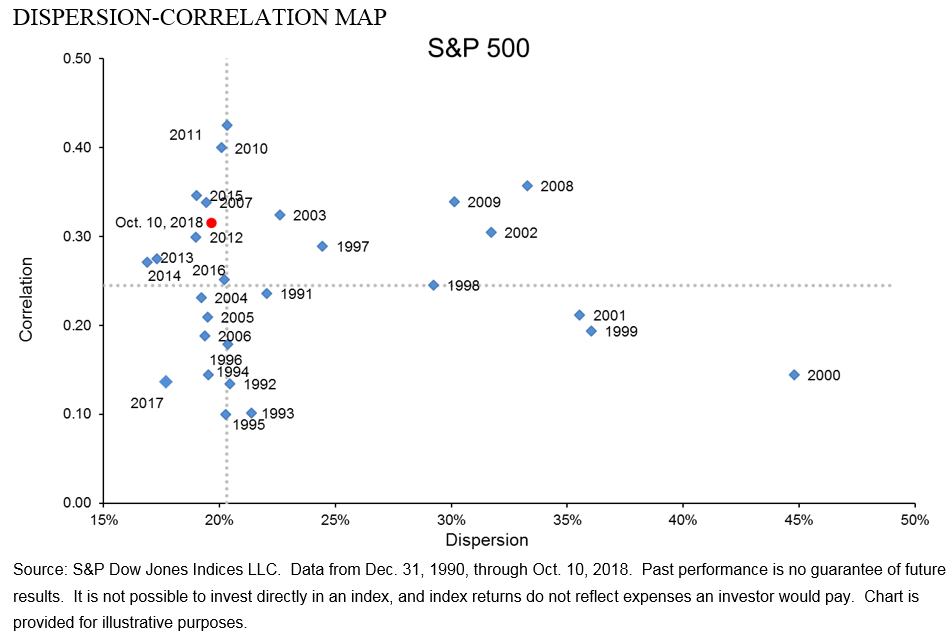
Breaking down volatility into its contributing components offers even more reassuring insight. The dispersion-correlation map offers a look at the two factors that drive volatility. The chart below maps the daily rolling 21-day dispersion and correlation levels since the beginning of August. The jump in both dispersion and correlation on October 10 was quite precipitous, but the levels are still lower than those we saw in February.

However, as the chart below reflects, from a broader context, yesterday’s market took us to above average levels for correlation, but dispersion is still under its 27-year average. This may seem striking given the particularly sleepy year in 2017, but these levels are still quite far from those in the tumultuous years of the technology bubble deflation and the financial crisis.

High dispersion does not guarantee weak markets, but in our data no severe market pullback has occurred in the absence of high dispersion.


The posts on this blog are opinions, not advice. Please read our Disclaimers.

Momentum Bubble Deflating?

Contributor Image
Craig Lazzara

Former Managing Director, Index Investment Strategy

S&P Dow Jones Indices

Yesterday’s decline in the U.S. and global stock markets is striking not simply because of its magnitude but also because it represents a radical reversal of factor returns from the first three quarters of 2018.

Readers of our quarterly factor dashboard will recognize this graph, which shows the total return of the S&P 500 and a set of factor indices derived from it for the 12 months ended September 30, 2018:

Momentum and Growth dominated the rankings for the first nine months of 2018 (as they had done in calendar 2017 as well).

Since the beginning of October, however, there has been an amazingly-abrupt (less than two weeks!) reversal of fortune, as today’s daily dashboard shows:

The winners so far in October were the first three quarters’ laggards, with previously-high flying momentum and growth names falling behind.  We pointed out several months ago that Momentum is uniquely self-reinforcing – until it suddenly isn’t.  And when the worm turns, Momentum’s underperformance can be particularly striking:

Will defensive factors assume market leadership while Momentum and Growth have a well-deserved respite?  Ten days do not a trend make, but what we see so far in October represents such a potential regime shift.

The posts on this blog are opinions, not advice. Please read our Disclaimers.