In prior posts, we reviewed the impact of rising interest rates on the S&P 500® Low Volatility Index returns. We showed that the low volatility index had negative exposure to rising interest rates, and thus has historically underperformed the S&P 500 in periods when interest rates rose significantly. In this post, we look at the S&P 500 Low Volatility Rate Response Index, a low volatility strategy that aims to reduce interest rate exposure, while maintaining the desired level of portfolio volatility reduction.
The construction of the rate response index is similar to that of the original low volatility index, with an additional step of removing the quintile of securities in the S&P 500 shown to have the most negative exposure to rising interest rates.[i] After these securities are removed, the 100 least volatile stocks are selected for inclusion into the index.
To determine the effectiveness of the rate response methodology, we examined the performance during rising interest rate periods. Exhibit 1 shows periods of significant increases in interest rates (1% or more in 10-year U.S. Treasury Bond yield) compared with the S&P 500. Additionally, we compared the rate response index with the low volatility index in these periods.
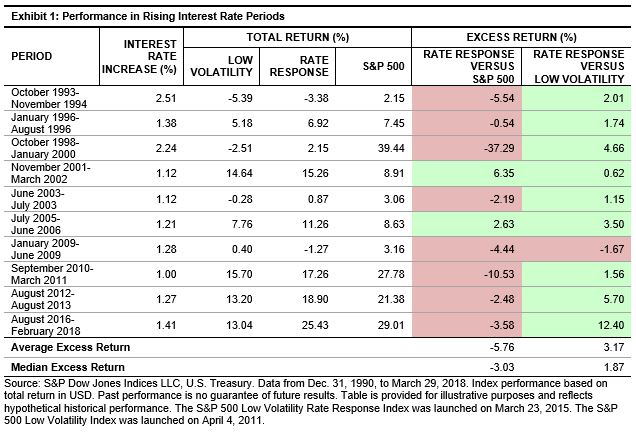
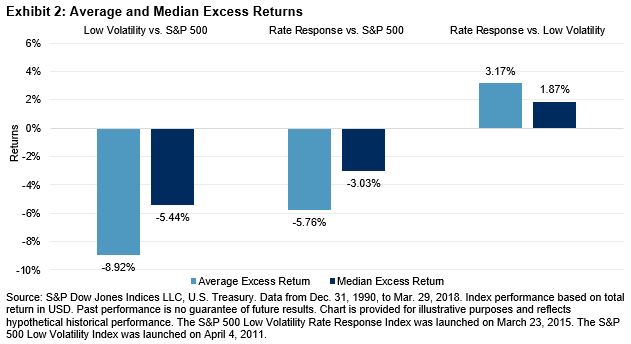
The rate response index generally underperformed the S&P 500, lagging the benchmark in 8 of the 10 periods—the average excess return over the S&P 500 was -5.76% and the median excess return was -3.03%. However, the rate response index fared better than the low volatility index in 9 of the 10 periods. For these periods, the rate response index outperformed the low volatility index by an average of 3.17% and a median of 1.87%. Exhibit 2 charts the average and median excess returns.
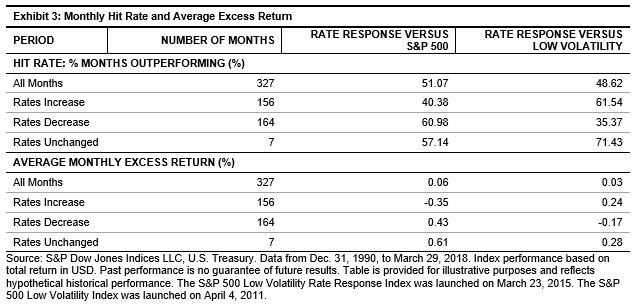
Looking at the relative performance based on monthly interest rate changes, the rate response index underperformed the S&P 500 the majority of the time when interest rates increased (average of -0.35%). Relative to the low volatility index, the rate response index outperformed nearly 62% of the time and by an average of 0.24% (see Exhibit 3).
The analysis in this blog shows that the rate response index historically outpaced the low volatility index in rising interest rate regimes. In a follow-up post, we will cover the historical performance of the rate response index compared with the low volatility index, concentrating on relative risk reduction versus the S&P 500.
[i] The interest rate exposure for each security is the resulting regression beta coefficient of monthly total returns to monthly yield changes in the 10-year U.S. Treasury Bond yield for the last 60 months. The most negative securities will have the lowest beta coefficient values. The full methodology of the index can be found on www.spindices.com.
The posts on this blog are opinions, not advice. Please read our Disclaimers.