Why a New Zealand Dividend Strategy Now?
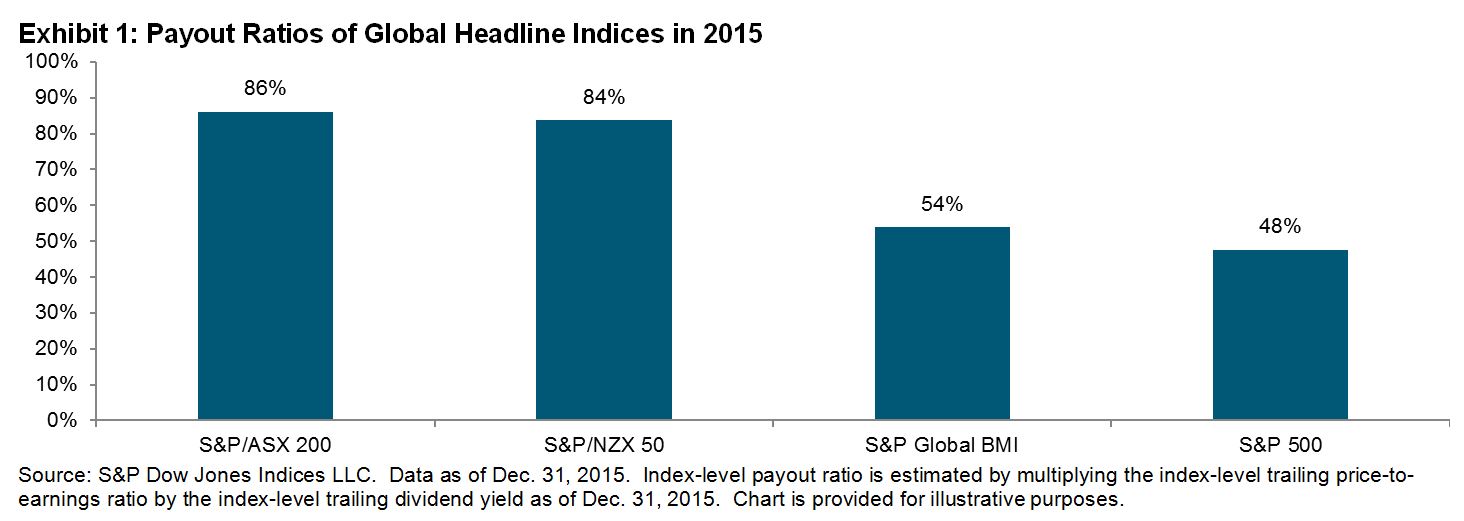
New Zealand companies pay out more profits as dividends than many other countries in the world, with an aggregate distribution of 84% of earnings in 2015, much higher than the 48% in the U.S. and 54% globally (see Exhibit 1).
One primary reason for this high payout ratio may be New Zealand’s dividend imputation regime, a rarity among countries around the world. The imputation policy boosts total return by promoting a good corporate dividend payout policy. More than 80% of New Zealand corporations surveyed by Ernst & Young in 2014[1] listed “meeting dividend payout target” as a leading driver of dividend policy.
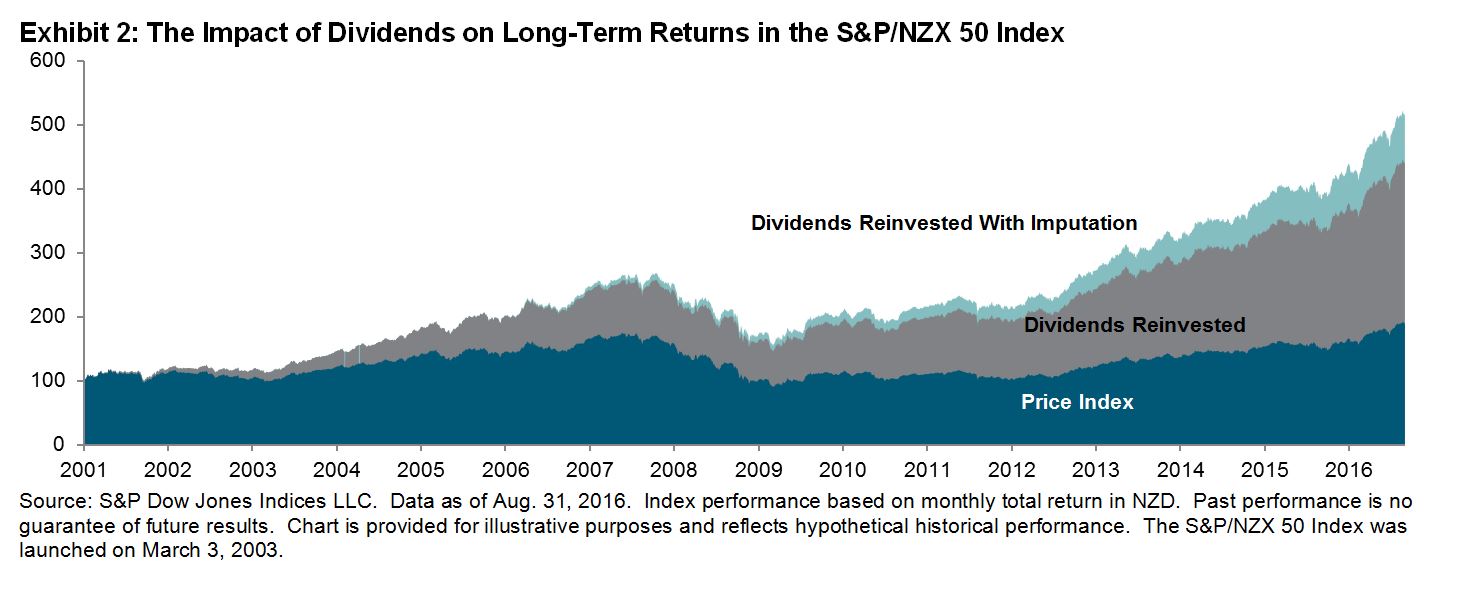
As a result, New Zealand’s dividend strategy may provide market participants with robust income. Exhibit 2 shows the significant role of dividends in total long-term equity returns. Between Jan. 3, 2001, and Aug. 31, 2016, approximately 60% of the S&P/NZX 50 Index’s total return was due to reinvestment of dividends, and 18% was due to reinvestment of imputation.
Why the S&P/NZX 50 High Dividend Index?
The S&P/NZX 50 High Dividend Index seeks to provide insight into the New Zealand equity market with a focus on dividends. It is constructed from the S&P/NZX 50 Index universe. The 25 companies in the S&P/NZX 50 Index with the highest dividend yields and liquidity are selected and form the S&P/NZX 50 High Dividend Index. Constituents are weighted by the product of float-adjusted market cap and trailing 12-month gross dividend yield (including imputation). The index is rebalanced semiannually, effective after the close on the third Friday of January and July.
How Does This Index Relate to Market Participants’ Portfolios?
Income generation and the potential for higher total return are two reasons why market participants might consider the S&P/NZX 50 High Dividend Index for their portfolios.
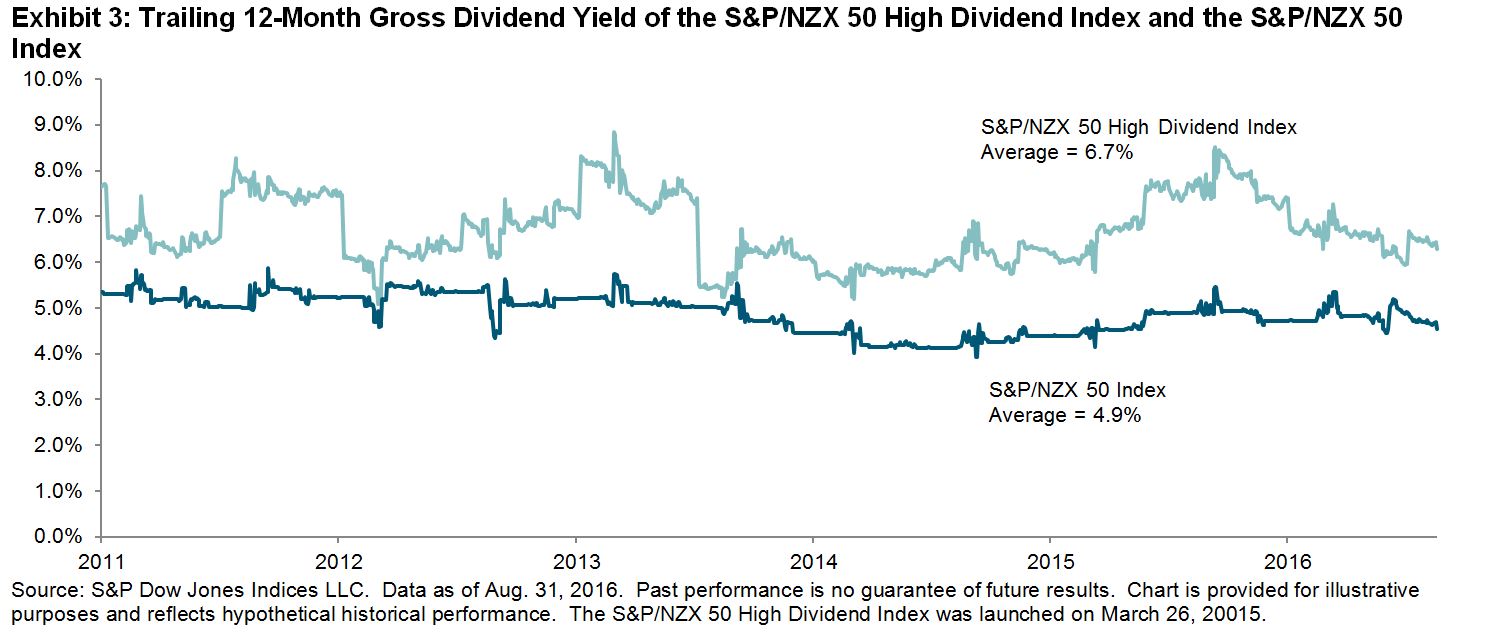
The historical yield of the S&P/NZX 50 High Dividend Index ranged from 5% to 9% between Dec. 31, 2010, and Aug. 31, 2016, while the yield of the S&P/NZX 50 Index fluctuated around 5%. Note that imputation is not taken into account in the yield computation. The income effect may be even more prominent for domestic market participants who could benefit from the imputation system.
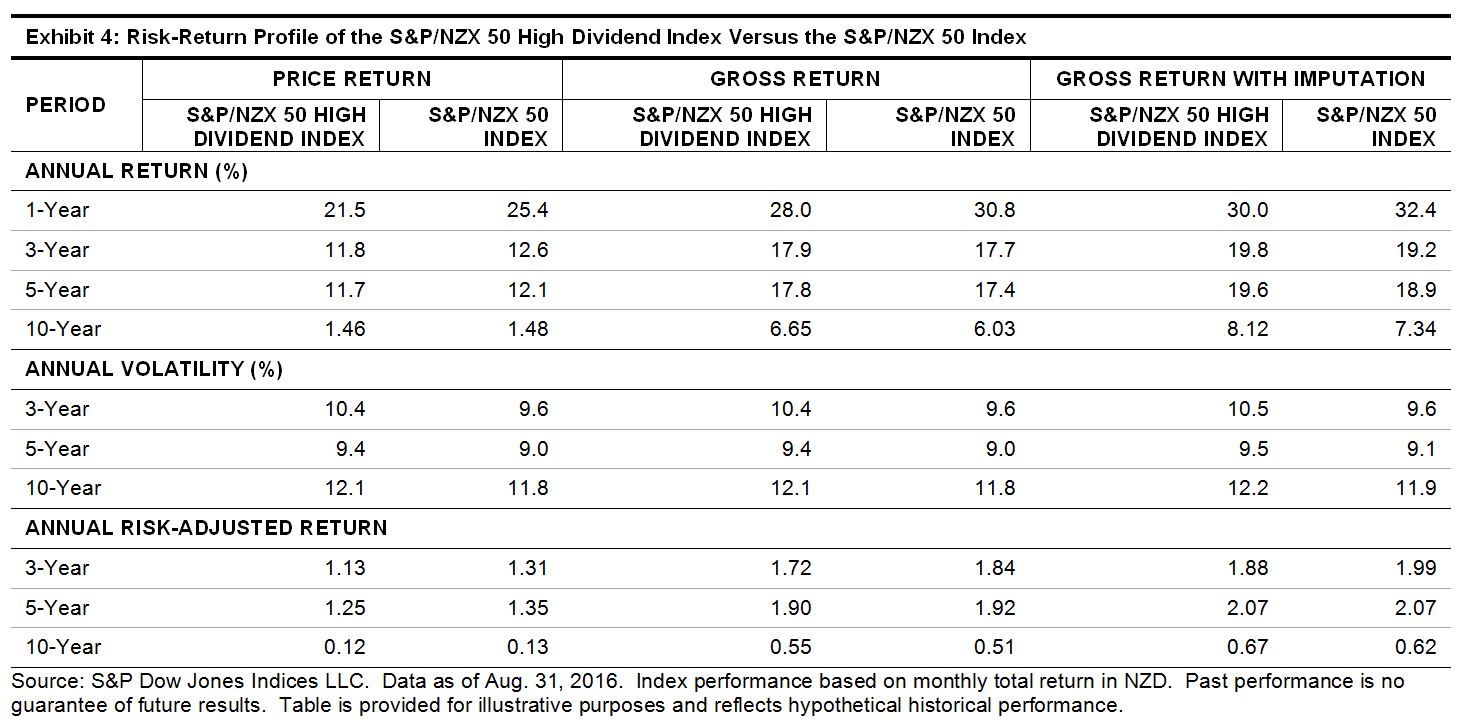
Given the strong income effect, the S&P/NZX 50 High Dividend Index managed to outperform the S&P/NZX 50 Index in terms of total return over the 3-, 5-, and 10-year periods ending Aug. 31, 2016, although there was slight underperformance in the price return version. Exhibit 4 shows the detailed risk/return profile of the index.
Ticker and More Information
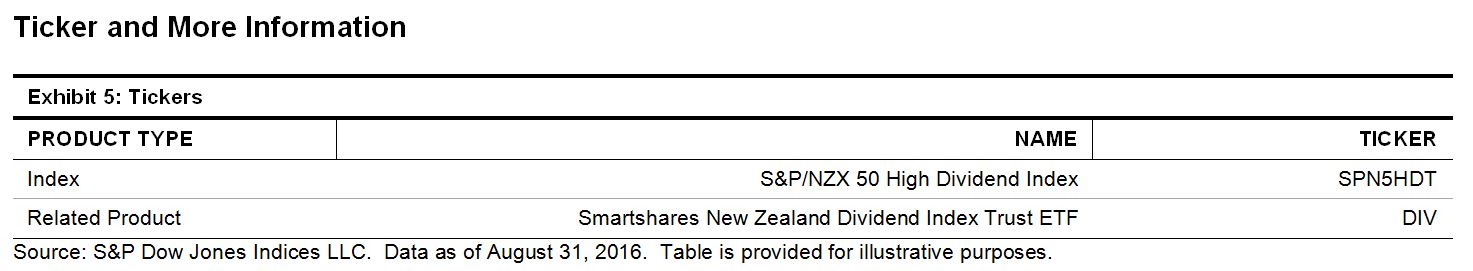
For more information, check out the S&P/NZX 50 High Dividend Index.
[1] Imputation and the New Zealand Dividend Psyche, Ernst & Young, September 2015, http://www.ey.com/Publication/vwLUAssets/ey-imputation-and-the-new-zealand-dividend-psyche-highlights/$FILE/ey-imputation-and-the-new-zealand-dividend-psyche-highlights.pdf.
The posts on this blog are opinions, not advice. Please read our Disclaimers.