Get Indexology® Blog updates via email.

In This List

An Unusual Thing Happened In August: Only Energy Rose

What’s Next from the Fed

A Closer Look at Payout Ratios and Earnings

Worse Than Marxism?

A simple model of aggregate dividend growth

An Unusual Thing Happened In August: Only Energy Rose

Contributor Image
Jodie Gunzberg

Former Managing Director, Head of U.S. Equities

S&P Dow Jones Indices

For the first time since March 2008, energy was the only positive sector in the S&P GSCI for the month in Aug.  Energy gained 6.2%, while agriculture, industrial metals, livestock and precious metals lost 5.7%, 3.2%, 0.4% and -4.0%, respectively.  Not only is this the first month in over 8 years for energy to rise alone, but it has only happened 9 times since energy entered the index in Jan. 1983.

Source: S&P Dow Jones Indices

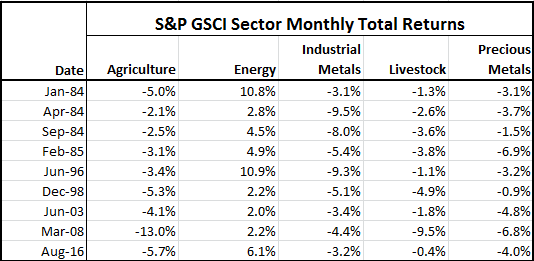
Historically, when energy rises, other sectors rise.  In 75% of the time, at least two other sectors rise, and on average gain 93 basis points. The sector performance, especially energy, has great influence on the overall returns of indices with different weights like the S&P GSCI that is world production weighted and the equally weighted Dow Jones Commodity Index (DJCI).  For example, it made the difference between being positive or negative for the month with the S&P GSCI gaining 1.8% and the DJCI losing 1.7% in August.

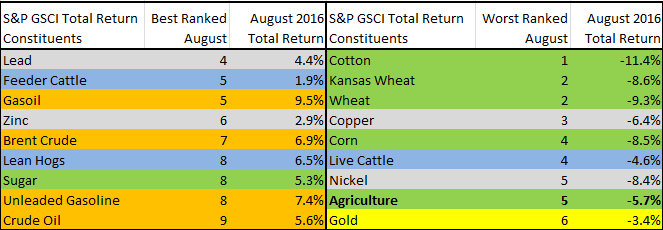
Although energy was the only positive sector, the individual commodity performance was dispersed. Almost half (11/24) were positive with at least two positive commodities from each sector, except precious metals that only includes gold and silver.  Gasoil gained 9.5% in Aug. and was the best performer while the worst performer was cotton that lost 11.4%, breaking a new record for its worst August ever with data since Jan. 1977.  That was in-line with most of the agriculture sector that was down, posting its 5th worst August ever. However, there was dispersion even inside the agricultural bloodbath, like from sugar. It gained 5.3% in Aug., that was its 8th best August in history from 1973. and its best 12-months in 5 years, up 71.6%.

Source: S&P Dow Jones Indices

The split performance shows how the fundamentals impact individual commodities and sectors separately. For example, while it seems oil is having major ups and downs, its volatility is only just over 35% that is slightly above its long-term average. In reality oil’s 90-day volatility has dropped from almost 60% in April to under 40% now, and is less than half its peak from the global financial crisis. Its moves are more controlled now and reflecting its fundamentals. Crude oil has had a total return of almost 40% since January when the suppliers have started to adjust. Since there are issues with OPEC’s ability to control the supply, the key for recovery is lower US inventories.  Volatility has also been about 1/3 less this year for metals and agriculture than in their 10-year histories.

Industrial metal commodity returns have had a big divide too. Copper lost 6.4% in August, driving it down 1.9% for the year while zinc is up another 2.9% for the month bringing its year-to-date gains to 42.6%. Zinc is now on pace to post its 3rd best year ever, only behind 2006 and 2009, using data from 1991. There have been supply cuts of zinc that may not be reversed until the companies feel they can produce again at sustainably higher prices. A similar story is true even for aluminum that is generally so abundant. However, the industrial metals as a sector are most sensitive to a weaker US dollar so if the dollar falls, that could be a big positive for the metals.

The Agriculture sector has been reacting as per its individual acreage and crop numbers. Its pricing is dependent mainly on the weather impacts and the commercial processor demand. For example, heavy rain has slowed sugar output, that has boosted prices; whereas cocoa prices increased from a drought.

Our 10th Annual Commodities Seminar takes place in London on 29th September. Additional information and registration are available online now. #SPDJICommods

The posts on this blog are opinions, not advice. Please read our Disclaimers.

What’s Next from the Fed

Contributor Image
David Blitzer

Former Managing Director and Chairman of the Index Committee

S&P Dow Jones Indices

Last weekend the Federal Reserve held its annual symposium at Jackson Hole Wyoming and discussed near and longer term monetary issues.

No Rate hike in September

There are three FOMC meetings remaining this year: September 21st, November 2nd and December 14th. While there is no rule that all interest rate target changes must come at FOMC meetings, the focus is on the September and December meetings.  The November session is less than a week before the election so most believe that the (more or less) apolitical central bank will avoid November.  Given comments during and since the Fed’s annual August Jackson Hole meeting last weekend, a rate increase before the end of the year is a good bet.  With unemployment at 5% and inflation seeming to approach 2% from below, the central bank is comfortable with an increase in interest rates.  The choice between September and December depends on how the upcoming data look.  The first and most important number will be Friday’s report on employment.  Lately the monthly increase in jobs has been around 190,000; it will take a figure substantially higher than that to get a rate increase in September.  More likely, the central bank will wait until December when there will be a longer track record on employment and a strong GDP figure for the third quarter. If last December’s rate increase and one this year are seen as a new tightening cycle, it will be both slow and weak compared to history as seen in the chart.

No More Unconventional Policy

Past quantitative easing inflated the Fed’s balance sheet and made traditional open market operations ineffective for setting interest rates. In response the Fed now pays interest on excess reserves banks hold at the Fed and uses reverse re-purchase agreements to adjust the fed funds rate target.  In her speech at the Jackson Hole symposium, Fed Chair Janet Yellen said the current process is working.  She also expressed confidence that the Fed will be well positioned to deal with a future downturn in the economy given the current policy tools including interest rate management, quantitative easing and forward guidance. Any discussion of negative interest rates was notably absent from her remarks. The second chart shows the recent evolution of the balance sheet.

Fed Balance Sheet

Sometime in the (more distant) future, the Fed is likely to begin efforts to shrink the size of its balance sheet. However, an early return to old fashioned open market operations is probably far off.

Some Unconventional Thinking

Conventional thought believes the Fed handles monetary policy, sets interest rates and attempts to control the inflation rate while the Treasury acting for the federal government is responsible for taxes, spending and the budget deficit (or surplus if one occurs).  At the Jackson Hole sessions Professor Christopher Sims of Princeton University argued that this division of labor doesn’t always work.  The central bank’s ability to control the money supply is limited by how many bonds it can buy or sell; and the number of bonds is determined by the treasury.  Higher interest rates raise spending by the Treasury, lead to either greater bond issuance or changes in taxes. However, if no one wants to buy the bonds, the central bank is expected to step up and be the buyer of last resort to finance the government deficit.

One message is that both monetary and fiscal policies are necessary for successful economic policy; however together they may not be sufficient.

The posts on this blog are opinions, not advice. Please read our Disclaimers.

A Closer Look at Payout Ratios and Earnings

Contributor Image
Erik Norland

Executive Director and Senior Economist

CME Group

Beyond the growth in nominal GDP, the other two macro-factors that may influence the returns of the S&P 500® Dividends Index: payout ratios and corporate earnings.

When corporations make profits, they have a choice: They can either reward shareholders or they can retain and reinvest the earnings.  While some companies, notably fast-growing technology firms, opt to retain all of their earnings, most choose to pay out a portion in dividends.  These dividend payout ratios fluctuate over time, though not necessarily with a strong correlation to the economic cycle.  Payout ratios rose during the 1980s boom but declined during the period of strong growth during the 1990s.  They also fell substantially during the 2008 recession, but rose during the most recent expansion. Dividend payout ratios can also fluctuate in response to changes in tax policy. Over the past few decades, payout ratios have averaged to around 40-50%.

Corporate Earnings
Corporate earnings rarely exceed 10% of GDP. They reached this level briefly in 2006 and hovered around 10% from 2011 to 2014.  They have since dropped to around 8.5% because the labor market has tightened, wages have begun to rise while productivity growth has remained slow.  All of these factors are putting downward pressure on corporate profits.  The impact of declining corporate profits on dividends has been offset by two other factors:

  1. Continued growth in nominal GDP, which has been growing at around 3.5% year on year.
  2. A rising dividend payout ratio, which now exceeds 50% of earnings.

Notably, when corporate earnings peak as a percentage of GDP and begin to decline, equity prices can continue to rise. During the 1990s, earnings peaked as a percentage of GDP in 1997 while stocks continued to rise until 2000.  During the subsequent decade, earnings peaked relative to GDP in 2006 but stocks didn’t reach their highest levels until late 2007.  Likewise, this time around, earnings as a percentage of GDP may have plateaued in 2011-14 and then began falling, but the S&P 500® continued upward and broke to a new record high (Figure 1).  As such, a peak in earnings doesn’t necessarily imply an imminent peak in equity prices.  That said, post-peak earnings declines often correlate with periods of rising equity volatility (Figure 2).

Capture

Capture

The posts on this blog are opinions, not advice. Please read our Disclaimers.

Worse Than Marxism?

Contributor Image
Craig Lazzara

Former Managing Director, Index Investment Strategy

S&P Dow Jones Indices

The investment community was bombarded last week with a paper arguing that passive investing is “worse than Marxism.”  That any putatively-serious observer can compare an investment strategy, even one he doesn’t like, with a political ideology responsible for the deaths of millions boggles the imagination, but maybe I’m just too sensitive.  The paper’s argument seems to be that the macroeconomic function of financial markets is to direct capital to its most efficient use, and that only active management contributes to this effort.  In reply we offer several observations:

First, we can’t resist observing that not all active trading contributes to efficient capital allocation.  We have only to remember names like Pets.com or Drkoop.com to recognize that active managers are fallible human beings; they sometimes get it wrong, and when they do capital can be badly misallocated.  One of the ways the economy might adjust to such misallocations is to reduce the assets entrusted to those who made them.

Second, when passive alternatives are offered in a market that was formerly dominated entirely by active managers, where do the passive assets come from?  If you believe that some active managers are more skillful than others, and that their skill is manifested in outperformance, then presumably it must be the least skillful active managers who lose the most assets.  In that case, the existence of a passive alternative raises the quality of the surviving active managers, and thus contributes to market efficiency.  (Note, though, that increasing the ability of the average manager doesn’t translate to outperformance for the average manager’s clients – a conundrum first noticed by Charles Ellis more than 40 years ago.)

Third, active traders trade with other active traders.  If an active manager spots what he believes to be an opportunity and wants to allocate capital to a particular stock, he’ll have to buy it from another active manager (or from a dealer who will lay off the position to another active manager).  An index fund would have no reason to be the source of liquidity for such an information-driven trade.  Whether index funds represent 5% of assets or 50%, all information-driven trades are between two active managers.

Finally, active management’s share of trading is far higher than its share of assets; it is trading that sets prices and drives market efficiency.  Under reasonable assumptions, if half of the market’s assets are indexed and half managed actively, the active managers will still do 91% of the trading.  Indeed, if three-quarters of assets are managed passively, active managers will do more than three-quarters of all trading.

We don’t need to learn The Internationale just yet.

The posts on this blog are opinions, not advice. Please read our Disclaimers.

A simple model of aggregate dividend growth

Contributor Image
Erik Norland

Executive Director and Senior Economist

CME Group

Dividends are getting more and more into the spotlight as overall corporate earnings growth continues to face many challenges in a low inflation and relatively slowly growing world.  And, a U.S. Treasury 10-year note yield of sub-2% certainly adds interest to the dividends that can be earned from S&P 500® companies.  And, dividends may also provide a modest potential hedge against changes in nominal GDP growth, should the economy decelerate unexpectedly.

The principal drivers of dividends are corporate profit growth and payout ratios.  From an economic perspective, the amount of dividends market participants should expect for the whole economy may be defined by the following formula:

Aggregate Dividends = (Nominal GDP) x (Corporate Earnings as % of GDP) x (Average Dividend Payout Ratio)

That is, aggregate dividends can be determined arithmetically by nominal GDP, corporate earnings as a percent of nominal GDP, and the average dividend payout ratio.

Moreover, dividends are a key component of one of the most venerable means of valuing equity markets  — the dividend discount model, which holds that equity valuations are (or should be) equal to the discounted value of future dividends.

Currently markets are pricing slow growth for dividends.  The December 2020 futures price for S&P 500® dividends points to 50.1 index points versus 45.6 for December 2016.  This implies a modest 2.2% annualized growth rate over the last four years of this decade.  Nominal GDP might expand a little faster than that, perhaps at around 3.5% or 4% per year, assuming 1.5% to 2.0% real growth and a similar level of inflation.  In turn, this implies that corporate earnings, from which dividends are paid out, will likely grow more slowly than nominal GDP.

Market participants have been revising their views on dividends and are becoming much more optimistic.  Since February, pricing for 2020 dividends has risen from 44.35 index points to 50.1 — a 12% increase.  This increase comes on the back of a 20% rise in the S&P 500® index as equity investors become more optimistic about prospects for firms in general (Figure 1).

Capture

We are living in a slow growth world, however, and the rather modest expectations for dividend growth reflect that.

All examples in this report are hypothetical interpretations of situations and are used for explanation purposes only. The views in this report reflect solely those of the author and not necessarily those of CME Group or its affiliated institutions. This report and the information herein should not be considered investment advice or the results of actual market experience.
S&P Dow Jones Indices is an independent third party provider of investable indices.  We do not sponsor, endorse, sell or promote any investment fund or other vehicle that is offered by third parties. The views and opinions of any third party contributor are his/her own and may not necessarily represent the views or opinions of S&P Dow Jones Indices or any of its affiliates.

The posts on this blog are opinions, not advice. Please read our Disclaimers.