Get Indexology® Blog updates via email.

In This List

Lose Money In The Bank: The ECB Announces Negative Interest Rates

El Niño: ¿Dónde Está El Dinero?

Where’s all the volatility gone?

The Gold War of India's Policy vs. U.S. Economy

U.S. Investment Grade Corporates Are Performing Well, Does A Euro Rate Cut Follow The Recent Dip?

Lose Money In The Bank: The ECB Announces Negative Interest Rates

Contributor Image
David Blitzer

Former Managing Director and Chairman of the Index Committee

S&P Dow Jones Indices

The European Central Bank (ECB) announced negative interest rates. The rates apply only to certain funds that banks keep on deposit at the central bank. Negative interest rates do not apply to individuals’ bank accounts. If a bank has one million euros on deposit with the central bank, a year later it will have a thousand euros less – it will have paid interest to leave the money in the central bank.  And that is exactly why the ECB is charging for holding the money – it wants banks to loan the money to businesses to encourage investment and economic recovery.

This unusual move – tried once or twice before in other countries with little result – is because the European economy is weak and prices are on the edge of falling into deflation.  The ECB describes this as the logical extension of normal monetary policy: when inflation is too high, the central bank raises interest rates in an effort to deter borrowing by making it more expensive. When inflation is too low, prices are close to falling and the economy is weak, the central bank cuts interest rates.  The latest reductions announced today (June 5th) pushed interest rates down with the rate for refinancing operations, similar to the Fed Funds rate in the US, at 15 bps. To keep a 25 bp spread above the rate paid on bank deposits at the ECB; the deposit rate was reduced to -10bps.

This isn’t likely to create a surge of bank lending overnight. First, the drop into negative numbers seems as much a symbolic statement as a serious plan to charge banks.  Second, there are not too many immediate options for banks. They could withdraw deposits from the central bank and hold the funds as currency.   The amounts are sufficiently large that where it is stored, and how it is protected, are real issues. A bank could try to deposit the funds in another bank, but this just means a lot of liquidity looking for a home.  Hopefully the news of negative interest will encourage business to spend or invest once they realize that money is (almost) free, for the moment.

Deflation is both a sign of economic weakness and a real danger.  In a weak, no growth economy there is no pressure on prices, little demand for most goods or services and flat to falling wages as unemployment rises.  Falling prices signal spreading economic malaise.  Deflation can be a greater danger – when prices fall, just about everything except for cash is worth less; cash is worth more because each dollar buys more.  In effect, dollars are more expensive.  A borrower needing money to repay a loan must work longer and harder to repay the loan because his labor is worth less. This debt-deflation spiral can send an economy into a deep recession or worse.  This is why the ECB and others fear deflation.

The posts on this blog are opinions, not advice. Please read our Disclaimers.

El Niño: ¿Dónde Está El Dinero?

Contributor Image
Jodie Gunzberg

Former Managing Director, Head of U.S. Equities

S&P Dow Jones Indices

Climate scientists are predicting record breaking global temperatures from an El Niño expected this year that could boost commodity prices from further disruptions in the supply chain.  This year has already been chock-full of supply shocks across many commodities such as nickel, natural gas, coffee and hogs, creating critically low inventories that will be extremely difficult to replenish – especially in volatile weather conditions.   

Already climate change has impacted the agriculture sector, so an El Niño may have an even greater impact amid the global warming. Does this mean there may be an opportunity for outsized returns from agriculture or other sectors?

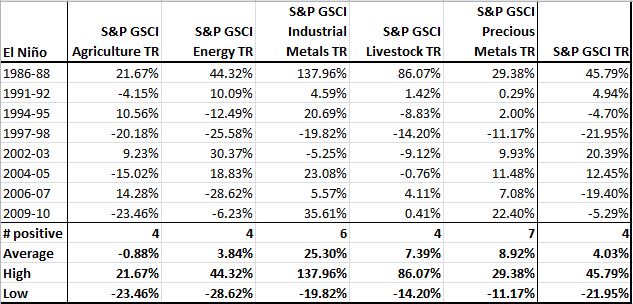
The Oceanic Niño Index has indicated eight historical El Niño periods in the time frame since 1983, when sector data is available for the S&P GSCI. Surprisingly, it’s not the agriculture sector that benefits, at least right away. Notice only 4 of 8 periods resulted in positive returns for the S&P GSCI Agriculture with a slightly negative average return of 88 basis points.  However, livestock fared better with premiums of 7.4%, and the metals showed positive performance in most of the periods with average returns of 25.3%  and 8.9% from industrial metals and precious metals, respectively. The super high return in 1986-88 is interesting since the commodity stock cycle was at a similar turning point as today.

Source: S&P Dow Jones Indices and http://ggweather.com/enso/oni.htm. Data from Jun 1983 to May 2014. Past performance is not an indication of future results. This chart reflects hypothetical historical performance. Please note that any information prior to the launch of the index is considered hypothetical historical performance (backtesting).  Backtested performance is not actual performance and there are a number of inherent limitations associated with backtested performance, including the fact that backtested calculations are generally prepared with the benefit of hindsight.
Source: S&P Dow Jones Indices and http://ggweather.com/enso/oni.htm. Data from Jun 1983 to May 2014. Past performance is not an indication of future results. This chart reflects hypothetical historical performance. Please note that any information prior to the launch of the index is considered hypothetical historical performance (backtesting). Backtested performance is not actual performance and there are a number of inherent limitations associated with backtested performance, including the fact that backtested calculations are generally prepared with the benefit of hindsight.

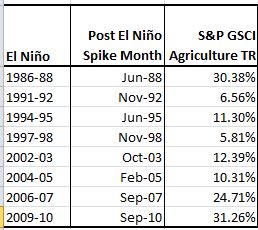
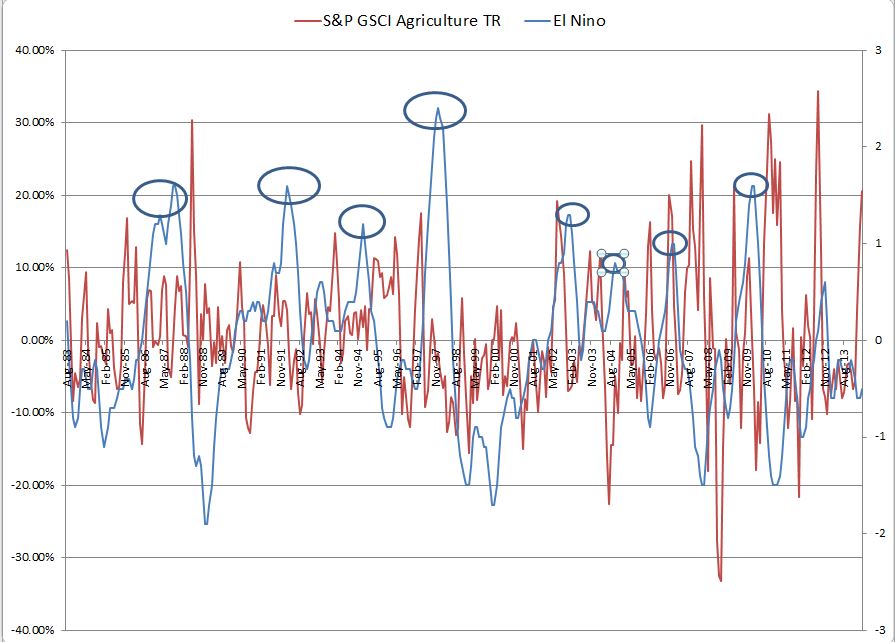
Despite the average positive returns in all sectors except agriculture during El Niño, this does not mean there are no opportunities to profit in agriculture from the crazy weather.  The spikes in the sector happen with a lag, so it could take up to a year or more to feel the impact though usually at least one spike happens very soon after.  On average the first spike month has returned 16.6% with several possible high spikes following. Please see the table and chart below.

Source: S&P Dow Jones Indices and http://ggweather.com/enso/oni.htm. Data from Jun 1983 to May 2014. Past performance is not an indication of future results. This chart reflects hypothetical historical performance. Please note that any information prior to the launch of the index is considered hypothetical historical performance (backtesting).  Backtested performance is not actual performance and there are a number of inherent limitations associated with backtested performance, including the fact that backtested calculations are generally prepared with the benefit of hindsight.

Source: S&P Dow Jones Indices and http://ggweather.com/enso/oni.htm. Data from Jun 1983 to May 2014. Past performance is not an indication of future results. This chart reflects hypothetical historical performance. Please note that any information prior to the launch of the index is considered hypothetical historical performance (backtesting).  Backtested performance is not actual performance and there are a number of inherent limitations associated with backtested performance, including the fact that backtested calculations are generally prepared with the benefit of hindsight.
Source: S&P Dow Jones Indices and http://ggweather.com/enso/oni.htm. Data from Jun 1983 to May 2014. Past performance is not an indication of future results. This chart reflects hypothetical historical performance. Please note that any information prior to the launch of the index is considered hypothetical historical performance (backtesting). Backtested performance is not actual performance and there are a number of inherent limitations associated with backtested performance, including the fact that backtested calculations are generally prepared with the benefit of hindsight.


The posts on this blog are opinions, not advice. Please read our Disclaimers.

Where’s all the volatility gone?

Contributor Image
Tim Edwards

Managing Director, Index Investment Strategy

S&P Dow Jones Indices

Last month, as in many this year, the majority of developed markets eked out respectable gains. The S&P 500® closed May at a new high, as did the S&P Global 1200 index of worldwide large cap equities. The S&P Europe 350 nudged up to levels not seen since 2007. All would appear to be going well.

Nonetheless, such calm markets prove fertile ground for speculation. Particularly of note is a swathe of articles and commentary pointing out that implied volatility (measured, for example, by the VIX) is low, and options prices are very, very low. Have the actions of central bankers made the equity markets become complacent? Or is the VIX somehow “broken?”

The first question is beyond us. We just don’t know if the average investor is currently guilty of irrational exuberance, and we would be suspicious of anyone who claimed to know just how exuberant we should be. Forecasting is no easier now than eighty years ago.

Most of the investors I’ve spoken to recently are in fact rather worried about what’s next, but there’s a wide spread of opinions as to what one’s primary worry should be. That speaks – perhaps – to a decrease in correlations as much as to a decrease in volatility. And there’s certainly evidence to support this, notably from an ex-U.S. perspective:

Capture

Source: S&P Dow Jones Indices Correlation & Dispersion Index Dashboard, June 2nd 2014

One of the features of volatility (measured at the level of whole markets) is that it’s very dependent on correlation, although the relationship is subtle. If stocks move independently, their aggregate impact on the market is diminished. If stocks move together, the market whips around with their combined movement.

As we’ve noted before, it is entirely possible that correlations will spike up in response to a macroeconomic crisis event. In the meantime, however, the prevalently low correlations are providing diversified investors with an unusually smooth ride.


The posts on this blog are opinions, not advice. Please read our Disclaimers.

The Gold War of India's Policy vs. U.S. Economy

Contributor Image
Jodie Gunzberg

Former Managing Director, Head of U.S. Equities

S&P Dow Jones Indices

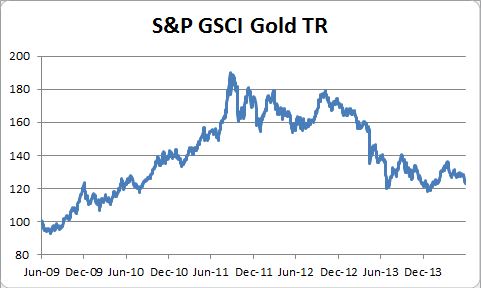
The S&P GSCI Gold lost 3.9% in May and has hit its lowest index level since January.

Source: S&P Dow Jones Indices and Bloomberg. Data from Jun 2009 to May 2014. Past performance is not an indication of future results. This chart reflects hypothetical historical performance. Please note that any information prior to the launch of the index is considered hypothetical historical performance (backtesting).  Backtested performance is not actual performance and there are a number of inherent limitations associated with backtested performance, including the fact that backtested calculations are generally prepared with the benefit of hindsight.
Source: S&P Dow Jones Indices and Bloomberg. Data from Jun 2009 to May 2014. Past performance is not an indication of future results. This chart reflects hypothetical historical performance. Please note that any information prior to the launch of the index is considered hypothetical historical performance (backtesting). Backtested performance is not actual performance and there are a number of inherent limitations associated with backtested performance, including the fact that backtested calculations are generally prepared with the benefit of hindsight.

This questions whether gold can recover after its biggest historical drop since 1981.  According to the Federal Reserve, the U.S. economy is strengthening, labor market conditions are improving and inflation has been low in the expanding economy.  According to Yellen, “looking ahead, I expect that economic activity will expand at a somewhat faster pace this year than it did last year, that the unemployment rate will continue to decline gradually, and that inflation will begin to move up toward 2 percent.”

These comments don’t fare well for gold so India’s import policy may be its only hope for price recovery.  Below is a summary of questions from a recent interview about the driving forces of gold.

Gold prices have cooled off in recent weeks and are hovering at around $1280-1290 an oz. The price is much below the year-before when levels of about $1380-1400 was seen in May 2013. What according to you is causing weakness in gold prices?  The idea of gold as a safe haven means investors have used gold as a store of value.  As the Fed tapers, the risk-off environment is subsiding with a potentially improving U.S. economy and stronger dollar, so the demand for gold as a safe haven has declined putting pressure on the price.

What are the factors that can help gold prices recover from these levels? Do you see that happening any sooner? A crisis might drive up demand for gold, which we have seen in mini waves as compared with the sizable global financial crisis. Recently spikes occurred from the tensions between Ukraine and Russia.  Other supporting factors could be if Indian imports improve from lesser restrictions or if the Chinese local premiums increased to about double their current $3 levels over the global benchmark.

India has been a major gold consumer globally. The Indian government had taken measures to restrict gold imports to bring current account deficit under control. Are these measures hurting the gold market globally? How do you think Indian policies with regard to gold play a role in global price determination? Anytime an outside force interferes with the supply and demand equilibrium, there is an impact.  India’s restriction on gold imports has had an adverse effect on the price of gold by fundamentally enlarging the supply pool in circulation – or in other words –  restricting demand from the world’s second largest consumer.

What are your views about the industrial metals’ demand and supply scenario for the rest of the year? Do you think Chinese demand and inventory built-up would continue this year for copper and other metals? With low inventories across the commodity complex, industrials are more susceptible to supply shocks than demand drops. Opposite from the impact on gold price from India’s import restriction is the positive price impact of the Indonesian export ban of nickel on nickel price, which is up 38.1% in the S&P GSCI in 2014.

What kind of movement in demand and prices do you expect in overall commodities market during this year?  The Chinese demand is having less of an impact on prices than the supply shocks since the inventories are low. The storage situations turned to shortages with diminished cushions to soften the blows of the shocks. This is a favourable environment for commodities from the combination of possible inflation and interest rate rises in conjunction with low inventories driving down correlations and up returns, again from supply shocks. We also may be at a turning point in the equity/commodity cycle that can be reflected through higher commodity performance than equity performance for the first time after six years.

How much importance does Indian commodities market hold in global markets? Is the new government formation in India going to affect commodities market globally? How? India is an important consumer of commodities, though the futures market is not yet developed enough to have contracts included from local exchanges in major indices. If the new government creates growth that may help the economically sensitive commodities like energy and industrial metals, but if there is turmoil, then gold may get a boost.

Several foreign investors and trade participants have shown lack of confidence in India’s commodity exchanges, as the largest exchange in India, Multi-Commodity Exchange (MCX) is facing legal issues with its promoter getting arrested for allegations of financial scam. Has it affected the confidence of market participants and investors overseas? The market impact of investor confidence is difficult to attribute to isolated factors, especially on less developed exchanges. Again, generally, if investors feel fear, they may flee to gold as a safe haven rather than economically sensitive commodities.

The posts on this blog are opinions, not advice. Please read our Disclaimers.

U.S. Investment Grade Corporates Are Performing Well, Does A Euro Rate Cut Follow The Recent Dip?

Contributor Image
Kevin Horan

Former Director, Fixed Income Indices

S&P Dow Jones Indices

The month of May closed on a high note for bonds as the drop in yields saw the S&P/BGCantor Current 10 Year U.S. Treasury Index closed at a yield of 2.47%.  Treasuries as measured by the S&P/BGCantor U.S. Treasury Bond Index returned 0.7% for the month and 2.12% year-to-date.

As of today, the yield on the 10-year is back up to 2.52% neighborhood after dipping down to 2.4%. Last week’s rally in all sovereign bonds is looking a bit reactionary to economic growth concerns both domestic and abroad.  Focus remains on the monetary stimulus expected by the European Central Bank this week as global central banking activity has been very accommodative and does not appear to be changing any time soon.

The U.S. economic calendar for this week started today with ISM Manufacturing at 53.4 versus the expected 56.2 and ISM Prices Paid at 60 versus the expected 57.  Construction Spending for April also came at a 0.2% which was expected to be at a 0.6%.  Tomorrow’s Factory Orders (0.5%, expected) and Wednesday’s MBA Mortgage Applications (-1.2%, prior), along with ADP Employment Change (213k, exp.) and Nonfarm Productivity (-3%, exp.) will help fill in the picture.  Thursday’s Initial Jobless Claims (310k, exp.) leading into Friday’s Change in Nonfarm Payrolls (215k, exp.) and the Unemployment Rate for May (6.4%, exp.) will be key determinants to the strength, or weakness, of the labor markets.

Investment grade corporates as measured by the S&P U.S. Issued Investment Grade Corporate Bond Index performed very well as the index returned 1.36% for the month and has returned 5.49% year-to-date.  2014’s return has been the best May year-to-date return since the 7.53% return of 2002.

Both the S&P U.S. Issued High Yield Corporate Bond Index and the S&P/LSTA U.S. Leveraged Loan 100 Index ended the month of May with total returns under 1%.  The indices returned 0.99% and 0.76% respectively month-to-date.  Numerous new high yield issues continued to come to market in names such as Audatex North America Inc., Baytex Energy, Cedar Fair, Interface Master Holdings Inc. and Precision Drilling.  Year-to-date the S&P U.S. Issued High Yield Corporate Bond Index has returned 4.69% while loans is lagging behind returning 1.91%.

Last week the S&P U.S. Preferred Stock Index (TR) returned 0.73% for the week adding to the month-to-date return of 1.36% and topping out at a year-to-date return of 10.40% for the month.  Comparing this hybrid bond/equity product to the S&P 500, the performance outshines the equity index which returned 2.35% for May and 4.97% year-to-date on a total rate of return basis.


Source: S&P Dow Jones Indices, Data as of 5/30/2014, Leveraged Loan data as of 5/31/2014.

The posts on this blog are opinions, not advice. Please read our Disclaimers.