Industrial Metals are historically the most economically sensitive sector besides energy. While Chinese oil demand growth is set at 3.6% in 2014 and HSBC’s Chinese Manufacturing Purchasing Managers’ Index (PMI) edged down to 50.8 in November, barely above the key 50-threshold delineating expansion from contraction, according to IEA’s OMR Report, nickel is the only commodity in petroleum and industrial metals to have positive performance in 2014, although it is up just 0.7% YTD (as of Jan 29 after losing 1.1% for the day.)
Many who are unfamiliar with nickel may wonder what it is used for, besides to strengthen the silver of the Stanley Cup. According to the Nickel Institute:
“Nickel-containing materials play a major role in our everyday lives – food preparation equipment, mobile phones, medical equipment, transport, buildings, power generation – the list is almost endless. They are selected because – compared with other materials – they offer better corrosion resistance, better toughness, better strength at high and low temperatures, and a range of special magnetic and electronic properties.”
Although the manufacturing numbers aren’t great, the reason nickel is the only commodity between energy and industrial metals that is performing well is because of its unique supply and demand model despite general macro factors.
According to Reuters, there is a ban on exports of key mineral ores from Indonesia unless they are processed in the country. However, weaker economic conditions have caused the ban to be lifted to allow shipments of copper, zinc, lead, manganese and iron ore concentrate, leaving nickel and bauxite – key ingredients in making steel and aluminium – the main targets.
Further, as FT.com points out, unlike copper, iron ore, lead and zinc, where miners were given a few years to phase out exports, shipments of nickel ore were cut altogether as of January 12th.
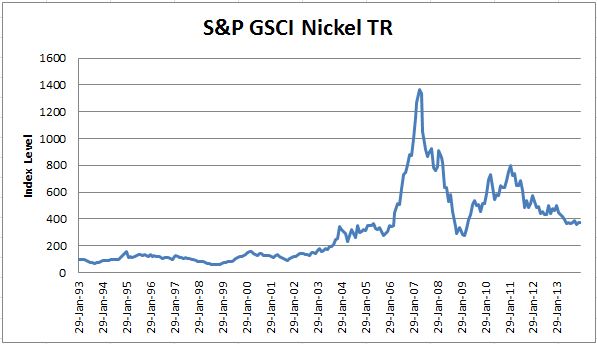
As you can see in the chart below, nickel has had a lackluster history post the financial crisis despite its gain of 188.0% from March 2009 to Feb 2011. Since Feb 2011, the S&P GSCI Nickel has given back more than half that gain, losing 53.5%.
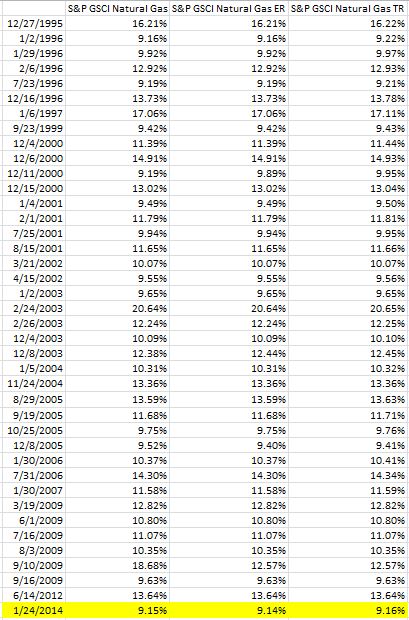
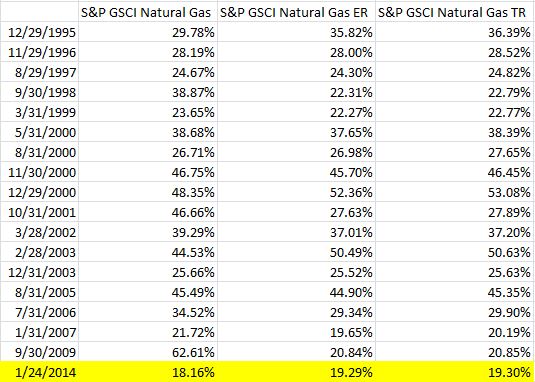
Also since Feb 2011, there have only been 13 of 35 months where the returns were positive and on average the positive monthly return was only 5.3%. This is compared to the negative 8.3% on average in the down months, which has hindered nickel from bigger profits. See below for the table of positive months since Feb 2011:
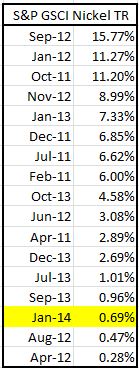
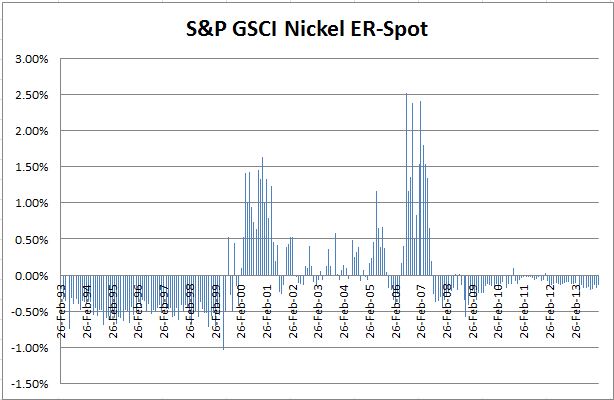
Source: S&P Dow Jones Indices. Data from Jan 1993 to Jan 2014. Past performance is not an indication of future results. This chart reflects hypothetical historical performance. Please see the Performance Disclosure at the end of this document for more information regarding the inherent limitations associated with backtested performance.
Despite the relatively weak economic industrial growth data from China that showed only 6% yoy in Dec 2013 versus 9.6% yoy in Nov 2013, demand for industrial metals like nickel may be on the rise. This is since they are linked with emerging technologies and electronic devices, including health care and biotech devices. For instance, some industry estimates show that demand for smart devices will increase 7–8% in developed markets, and 17% in emerging markets between 2012 and 2017. This may impact the demand, which may drive a comeback in prices.
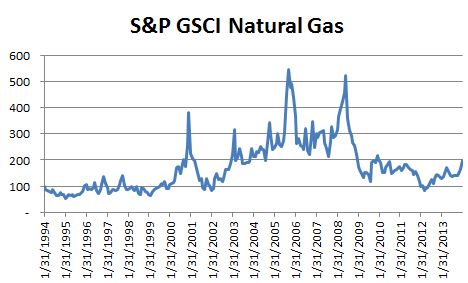
However, as consumers deplete the inventories from 2011, the balance may depend on how fast the producers can bring supply to the market and how the governments treat trading bans. The chart below depicts the cycle of inventories reflected by backwardation and contango as measure by the index. Notice there has not been a shortage since Dec 2011, and even then, it was small – adding only 3 bps. The question remains whether now could be the time of another cycle switch for a sustained period of shortage or backwardation in nickel, where front month investors may benefit.
The posts on this blog are opinions, not advice. Please read our Disclaimers.