Get Indexology® Blog updates via email.

In This List

Small Caps Beating Large By The Most In 16 Years

Performance Analysis of Liquidated Funds in Brazil – Part II

The Skill of Champions in Sports & Active Management

Fixed Income Liquidity and ETFs in India

On the Use of Bond ETFs by Insurance Companies

Small Caps Beating Large By The Most In 16 Years

Contributor Image
Jodie Gunzberg

Former Managing Director, Head of U.S. Equities

S&P Dow Jones Indices

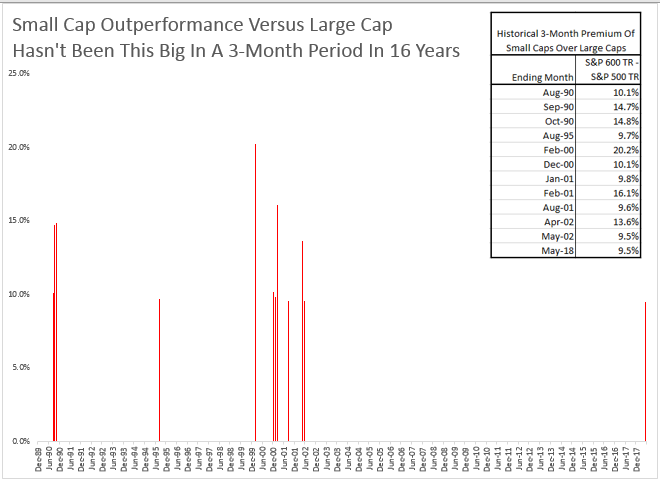
Small caps just outperformed large caps for three consecutive months for the first time since Sep. 2016.  From Feb. through May, the S&P SmallCap 600 (TR) outpaced the S&P 500 (TR) by 9.5%. It is the biggest premium realized in a three month period since the three months ending in May 2002.  In fact, outperformance this big has only happened in a three month period twelve times in history since Sep. 1989.

Source: S&P Dow Jones Indices.

Also, in May, all eleven sectors of the S&P SmallCap 600 gained for the month.  This is the first time all the small cap sectors are positive together in a month since Dec. 2016, and it is a historically quick comeback from Feb. when all the sectors were negative.  This is only the 9th time in history since Jan. 1995 that the small cap sectors went from all losing to all winning in three months or less, and the last time it happened was in Oct. 2015.

The small cap rally that drove the 6.5% total return of S&P SmallCap 600 in May was led by the Health Care +9.3%, Information Technology +7.9% and Real Estate +7.9% sectors.  Comparatively the S&P 500 posted a total return of 2.4% for the month, led by Information Technology +7.4%, Energy +3.0% and Industrials +3.0%.  Four sectors, Telecommunication Services,  Consumer Staples, Utilities and Financials lost in large caps, down a respective 2.3%, 1.5%, 1.1% and 0.9%.  The S&P MidCap 400 TR gained 4.1% in May with 9 of 11 positive sectors.

Source: S&P Dow Jones Indices.

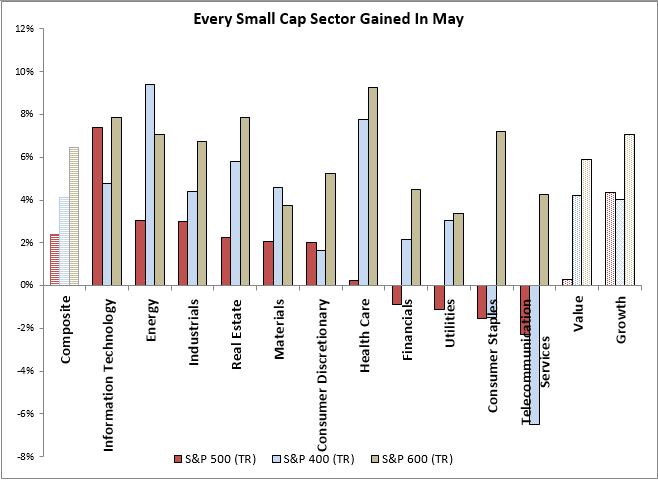
In May, health care measured outperformance of small caps over large caps of 9.0%, the most of any other sector.  As mentioned in this prior post, small cap health care companies have outperformed large caps for several reasons including healthy deal making, increased expectations for acquisition of smaller companies, stronger innovation from smaller companies and that smaller companies may be more immune to concerns about regulatory pressures in healthcare.

Another sector with almost just as much of a small cap premium in May is consumer staples with a premium of 8.8%.  The current economic backdrop is helping the small cap consumer staples more than the large caps in the sector (Note the large cap consumer staples lost for its fourth consecutive month, down a total of 13.9% from Jan. 31, 2018. It is the 8th worst four month return in history, and worst four months since the four months ending in Feb. 2009.)  Smaller consumer staple companies historically do better from GDP growth, gaining on average 5.9% per 1% of growth, as compared to the large caps that rise just 4.0%.  Furthermore, rising rates help small cap consumer staples more than large caps.  For every 100 basis point rate hike, small cap consumer staples rose 7.2% on average historically, whereas the same rate hike has only pushed large cap consumer staples up 4.0% on average.   Lastly, the strengthening dollar may be a force that helped the small caps in consumer staples since they do more domestic business.  On average per 1% rise in the U.S. dollar, the small cap consumer staples rose 1.8%  versus the large caps that rose only 1.3%.

As with all sectors, it is important to drill down further into industry groups, and in some cases even into the more granular industries and sub-industries for clarity about where the performance and potential opportunities exist within a sector.  In the case of consumer staples, there are three separate industry groups: 1. Food & Staples Retailing, 2. Food, Beverage & Tobacco and 3.  Household & Personal Products.  The Food & Staples Retailing industry group had the highest small cap premium for the month, with small caps outperforming large caps by 15.1%.  However, the contribution to the returns from the Food, Beverage & Tobacco industry group were far more substantial from a weight that is about 60% of the sector.  While the return spread of small over large in Food & Staples Retailing was far more than the 6.6% differential in Household & Personal Products, the contribution to return was slightly more from the Household & Personal Products due to the weight distribution.

Source: S&P Dow Jones Indices.

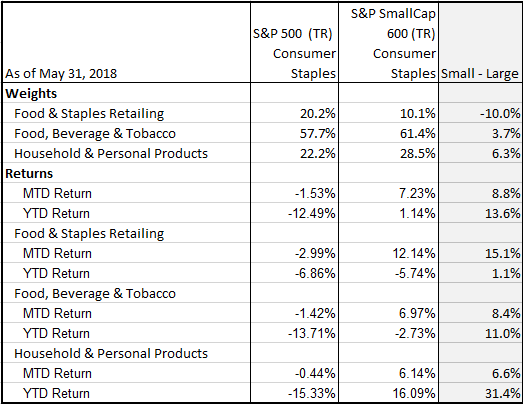
In considering strategy, it is not just the return but knowing the underlying weights, size and the number of stocks allowing for opportunity or diversification.   Note in the consumer staples sector, there are 33 stocks in the large caps and 20 stocks in the small caps, but when split by industry group, Food, Beverage and Tobacco has the majority with 21 big names and 11 small names.  Interestingly, the top 10 constituents total are similarly concentrated, comprising about 70% of each index with the top holding in each near 12%.  The biggest name is Altria Group Inc. and the biggest in the S&P 600 Consumer Staples is  Andersons Inc. The flexibility to change prices of goods quickly is a key to performance in this market, especially if inflation might be a concern.


The posts on this blog are opinions, not advice. Please read our Disclaimers.

Performance Analysis of Liquidated Funds in Brazil – Part II

Contributor Image
Phillip Brzenk

Managing Director, Global Head of Multi-Asset Indices

S&P Dow Jones Indices

In this blog, we estimate the impact of survivorship bias on the performance of active equity funds in Brazil compared with the benchmark, the S&P Brazil BMI. We do so by replicating the outperformance report from the SPIVA® Year-End 2017 Latin America Scorecard, while removing all the liquidated and merged funds. We noted in a prior blog that as a group, liquidated and merged funds in Brazil underperformed the benchmark by a wider margin than the overall SPIVA active fund universe in Brazil. Consequently, including only surviving funds in the research universe, instead of including all funds that were active at the start of the performance measurement periods, should result in an upward bias in outperformance, which we will demonstrate in this blog.

Exhibit 1 shows the percentage of funds in the Brazil Equity Funds category that outperformed the benchmark for one-, three-, and five-year periods as of year-end 2017. Two groups of funds were formed; the first group was the universe used in the SPIVA scorecard and the second group included SPIVA universe-eligible funds after removing the liquidated and merged funds.

We observed that surviving funds outperformed the entire fund universe for all three lookback periods. Additionally, the difference in outperformance figures between the two groups increased as the time horizon increased. While the percentage of funds outperforming the benchmark for the one-year period was not significantly different, for the five-year period 38% of surviving funds outperformed the benchmark, compared with just 18% for the SPIVA universe. This highlights the importance of correcting for survivorship bias, as the success of funds in the category looked materially different when only the surviving funds were included in the analysis.

The posts on this blog are opinions, not advice. Please read our Disclaimers.

The Skill of Champions in Sports & Active Management

Contributor Image
Hamish Preston

Head of U.S. Equities

S&P Dow Jones Indices

The last few days have been a feast of entertainment for the sporting enthusiast; the Champions League Final, the Monaco Grand Prix, and the NBA Conference Finals were all on the menu.  While the sports represented are distinct, these events have something notable in common: the persistence of their participants.  The same two teams reached the NBA Finals for the fourth consecutive year, the Champions League was won by the same team for the third year in a row, and the Monaco Grand Prix title went to a driver from a team that has regularly featured in the upper echelons of the sport.  In other words, in the sporting world, past performance has been a reasonable guide to future results.

One possible explanation for this persistence is that championship teams possess more skill than their competitors, and that, at the highest level of athletic competition, success depends importantly on skill.  Indeed, we might take the persistence among winners in football, basketball and motor racing as evidence that these activities reward – and are dependent upon – the skill of the participants.  (This very question – the relative importance of skill vs. luck in sporting outcomes – has actually been litigated for darts, pinball, and poker.)

In the popular imagination, active investment management mimics the engaging combination of luck and skill that sport can provide.  Certainly, the fame and fortunes accrued by the most skillful athletes are comparable to those of the most successful active managers.  But has the performance of active managers shown a similar degree of stability?

Over the last few years, S&P Dow Jones Indices has published a series of “Persistence Scorecards”.  Initially focused on the persistence of returns of domestic U.S. equity and fixed income managers, these scorecards have been extended to cover Australia and, most recently,  Latin America.  The results in each of these markets are clear; active managers have found it extremely difficult to consistently outperform their peers.  For example, Exhibit 1 shows that only 3.56% of the 1151 domestic U.S. equity funds whose returns were above the majority of their peers in the 12 months ending September 2013 could boast of a similar achievement at each September in the four consecutive years.  For context, the probability of flipping a coin and getting four consecutive heads is 6.25%.

Exhibit 1: Performance Persistence of Domestic U.S. Equity Funds.

This is by no means the first time that sports and the investment management industry have been considered side by side – Charles Ellis’ brilliant analysis is required reading in this regard.  While skill appears to be rewarded in sports, the evidence suggests luck dominates in the investment management industry.  Hence, investors may find it worthwhile to recall the sentence inserted into many a prospectus: “past performance is no guarantee of future results”.


The posts on this blog are opinions, not advice. Please read our Disclaimers.

Fixed Income Liquidity and ETFs in India

Contributor Image
Alka Banerjee

Former Managing Director, Product Management

S&P Dow Jones Indices

The fixed income market has historically been relatively illiquid in India, as well as globally. The Indian bond market is smaller than other Asian markets like China and Korea, but it is more liquid than they are, yet it is still largely inaccessible to retail investors. The nature of trading that is almost entirely over the counter, leading to price opacity, and the large issuance size of the bonds combine to make it out of reach for the average Indian investor. Bond exchange-traded funds (ETFs) may be able to solve these issues, which may be part of the reason bond ETFs have soared in popularity in developed markets recently.

The widespread perception is that bond ETFs help bring liquidity to the market. First, bond ETFs allow institutional and retail investors to partake in a larger pool of fixed income securities than they normally would have easy access to. Multiple bonds can be bought in smaller chunks defined by the ETF price and size, catering to all appetites, offering a solution to the large issuance size problem. In the case of Indian government securities, ETFs provide the smooth rollover benefit, where the most recently issued bond replaces the earlier issue with no costs associated for the investor, proving to be cost-effective for the average retail investor to manage. In addition, corporate bond market ETFs can be designed to capture desired duration and yield, which can make targeted exposure far easier to achieve.

Bond ETFs can offer low execution costs and allow price discovery. Buyers and sellers can offset each other, removing the need for the frequent buying and selling of underlying securities. As bond ETFs increase in popularity, the buying and selling of ETFs can far exceed that of the underlying securities, contributing to an overall increase in market liquidity. Price discovery happens as the price of the ETF should be a reflection of the index underlying it, which in turn is determined by the weighted sum of the underlying securities. In addition, the act of trading on stock exchanges, unlike for underlying securities, brings transparency to an opaque market. While investors can buy and sell ETFs as a single block, they don’t have to trade in the underlying securities. Authorized participants are permitted to trade in the underlying securities of the ETFs, with the ETF sponsor fulfilling the important role of keeping the net asset value of the ETF in line with the value of the underlying securities. Even during times of market stress, a bond ETF would be at least as liquid as the underlying securities. Finally, ETFs mandate the publication of the underlying securities to be made public daily, which makes the investment even more transparent than a bond fund.

The posts on this blog are opinions, not advice. Please read our Disclaimers.

On the Use of Bond ETFs by Insurance Companies

Contributor Image
Raghu Ramachandran

Head of Insurance Asset Channel

S&P Dow Jones Indices

Recently, S&P Dow Jones Indices published an analysis on the use of exchange-traded funds (ETFs) by U.S. insurance companies in their general accounts. This blog post provides additional details on the investments in Bond ETFs by insurance companies.

The original analysis noted that of the USD 27.2 billion insurance companies invested in ETFs, companies invested USD 7.9 billion in Bond ETFs. Insurance companies in every state—except Alaska, Delaware, Maine, and North Dakota—invested in Bond ETFs. However, companies in five states—Massachusetts, Indiana, Illinois, California, and Texas—accounted for 66% of the Bond ETF investments (see Exhibit 1).

As the paper noted, of the assets invested in Bond ETFs, companies chose to use the Systematic Valuation (SV) designation for 37%, or USD 2.9 billion, of the ETFs. SV is a “bond” like accounting treatment that has the potential to reduce volatility in statutory financials. Companies in 17 states accounted for all of the investments designated as SV. The top five states —Indiana, Massachusetts, Alabama, Connecticut, and Illinois— accounted for 86% of the SV investments (see Exhibit 2).

The overall U.S. use of the SV designation was 37%; however, of the Bond ETF investments in these 17 states, 49% had the SV designation. Exhibit 2 shows the distribution of Bond ETF investments in each state that used the SV designation.

Insurance companies decisively selected whether or not to use the SV designation. If they chose to use SV, they tended to use it for all their Bond ETFs. The companies that used SV designated on average  99.1% of their Bond ETF holdings as SV. Indeed, most of the companies designated 100% their Bond ETF holdings as SV.

The companies that used the SV designation also invested more heavily in ETFs.

The posts on this blog are opinions, not advice. Please read our Disclaimers.