Get Indexology® Blog updates via email.

In This List

The Commodity Flip NOT Flop Of 2014

Ouch! Oil Prices Sting Lower Credits, Pushing Yields Lower on Safer Bonds

Inside the S&P 500: The Dividend Aristocrats

A Keynesian Puzzle for Fed Watchers

Low Chinese CPI: A Commodity Catalyst?

The Commodity Flip NOT Flop Of 2014

Contributor Image
Jodie Gunzberg

Former Managing Director, Head of U.S. Equities

S&P Dow Jones Indices

Six months ago, commodities looked like they were on the brink of a comeback. The S&P GSCI Total Return gained 7.4% YTD through June 20 at its high.  Back then, almost a record number of commodities, 12, were in backwardation, reflecting shortages in Brent Crude, Cocoa, Copper, Corn, Cotton, WTI Crude Oil, Feeder Cattle, Gold, Live Cattle, Natural Gas, Soybeans and Unleaded Gasoline.

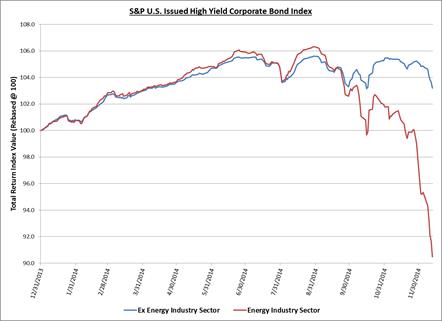
Now, the S&P GSCI TR has lost 1/3 of its value, mostly coming from oil since taken together WTI and Brent make up about 40% of the index with a total of 62% in the energy sector. Energy is down 42.8% from its high in June, and at first it seemed the other sectors were sliding with it. Notice in the table below that in the S&P GSCI TR, all the sectors posted losses from June 20 through most of the summer, with precious metals ending its losing streak just in November.

Source: S&P Dow Jones Indices LLC. All information presented prior to the index launch date is back-tested. Back-tested performance is not actual performance, but is hypothetical. The back-test calculations are based on the same methodology that was in effect when the index was officially launched. Past performance is not a guarantee of future results.  Please see the Performance Disclosure at http://www.spindices.com/regulatory-affairs-disclaimers/ for more information regarding the inherent limitations associated with back-tested performance.
Source: S&P Dow Jones Indices LLC. All information presented prior to the index launch date is back-tested. Back-tested performance is not actual performance, but is hypothetical. The back-test calculations are based on the same methodology that was in effect when the index was officially launched. Past performance is not a guarantee of future results. Please see the Performance Disclosure at http://www.spindices.com/regulatory-affairs-disclaimers/ for more information regarding the inherent limitations associated with back-tested performance.

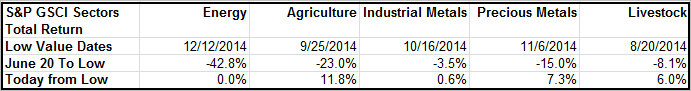
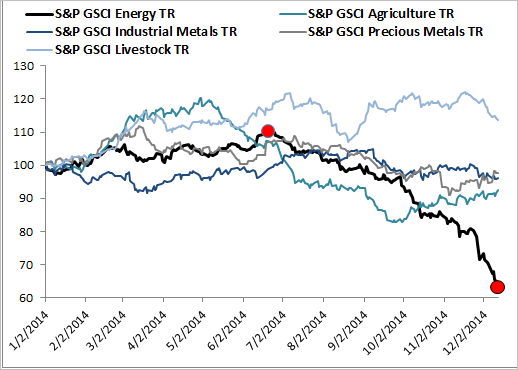
At some point the oil price slide decoupled from the other commodities since their fundamentals are different. From their respective bottoms, agriculture gained 11.8%, precious metals gained 7.3%, livestock gained 6.0% and industrials metals have been flat, gaining 60 basis points.  Nothing is overpowering Saudi’s oil supply in energy, but now energy seems to be on its own.  Below is the graph of the sector performance where energy’s lonely dropoff is clear.

Source: S&P Dow Jones Indices LLC. All information presented prior to the index launch date is back-tested. Back-tested performance is not actual performance, but is hypothetical. The back-test calculations are based on the same methodology that was in effect when the index was officially launched. Past performance is not a guarantee of future results.  Please see the Performance Disclosure at http://www.spindices.com/regulatory-affairs-disclaimers/ for more information regarding the inherent limitations associated with back-tested performance.
Source: S&P Dow Jones Indices LLC. All information presented prior to the index launch date is back-tested. Back-tested performance is not actual performance, but is hypothetical. The back-test calculations are based on the same methodology that was in effect when the index was officially launched. Past performance is not a guarantee of future results. Please see the Performance Disclosure at http://www.spindices.com/regulatory-affairs-disclaimers/ for more information regarding the inherent limitations associated with back-tested performance.

What’s changing? I have mentioned that low inventories are causing mean reversion that is likely to drive swings between winners and losers. These swings also show up in flipping term structures.  Over the summer through October the number of commodities that remained in backwardation dropped from 12 down to 4. Only WTI, Unleaded Gasoline, Copper and Feeder Cattle remained in backwardation. Today, WTI Crude Oil and Unleaded Gasoline have succumbed to the supply glut of oil so these commodities have lost their backwardated positions and are now in contango.

However, now, in December, the number of commodities that are in backwardation is TEN with six newly flipped commodities! This group includes Feeder Cattle, Heating Oil, Copper, Corn, Cocoa, Silver, Kansas Wheat, Lean Hogs, Coffee and Live Cattle.  News of hoarding from Vietnam of coffee, Russia with wheat and an export tax from India on sugar are supply issues that may be supporting this term structure.


The posts on this blog are opinions, not advice. Please read our Disclaimers.

Ouch! Oil Prices Sting Lower Credits, Pushing Yields Lower on Safer Bonds

Contributor Image
Kevin Horan

Former Director, Fixed Income Indices

S&P Dow Jones Indices

The yield-to-worst of the S&P/BGCantor Current 10 Year U.S. Treasury Bond Index moved down 22 bps last week, to close at 2.09%.  This level of yield has not been seen since June 2013.  The lowest level seen for this index was 1.4% in July 2012.  The index returned 1.49% MTD and 12.33% YTD as of Dec. 12, 2014.

This week, investors will be eyeing any news that comes out of the Fed’s last meeting for the year, which will be wrapping up this Wednesday.  Any indication on the timing of a rate increase could have an effect on the markets and its indices.

With the lack of inflation and an unforeseen drop in oil prices, many investors have recently moved out of stock and into the safety of sovereign and investment-grade bonds.  The “risk-off” move shows that investors are worried about the weakness in the economies of Europe and Japan, leading to concerns of a drag effect on the U.S. economy as well.  With low inflation currently, there is little cause for concern that an increase in inflation would detract from bond investments.

The S&P U.S. Issued Investment Grade Corporate Bond Index has benefitted from the current market environment, as last week’s news turned performance around after a slow start to the month.  As of Dec. 12, 2014, the index has returned 0.24% MTD and 7.75% YTD.  New issuance has been active and price deals are being issued, such as USD 1 billion in three-year paper issued by both American Honda and Goldman Sachs (floating-rate paper).  State Street also issued USD 1 billion, though their deal was for 10-year paper.  The newer fixed-rate paper should enter the index at year-end 2014 if all qualifying conditions are met.

Though still providing yield to portfolios, high-yield bonds have come under fire as the risk-off trades and the drop in oil prices have negatively affected the S&P U.S. Issued High Yield Corporate Bond Index.  As of Dec. 12, 2014, the index is down 2.96% MTD and has only returned 1.04% YTD.  The current YTD return is a far cry from the 5.7% YTD return it had achieved at the end of August 2014.  Energy bonds have been a big drag on the index, as the sector is 15% of the index’s weight.  As of Dec. 12, 2014, the industry sector is down 8.65% MTD and down 9.52% YTD, while excluding energy, the index is down slightly on the month at -1.93% and up 3.21% YTD (see Exhibit 1).

After positive returns for October and November, the S&P/LSTA U.S. Leveraged Loan 100 Index, like the high-yield index, has been knocked off track by recent events.  The index is down 2.06% MTD and has only returned 0.35% YTD as of Dec. 12, 2014.  At this point, the YTD return of 2.6% that was achieved in July is a distant memory.

Exhibit 1: S&P U.S. Issued High Yield Corporate Bond Index Performance
S&P U.S. Issued High Yield Corporate Bond Index Performance


Source: S&P Dow Jones Indices LLC.  Data as of Dec. 12, 2014.  Leverage loan data as of Dec. 14, 2014.  Charts and tables are provided for illustrative purposes.  Past performance is no guarantee of future results.

The posts on this blog are opinions, not advice. Please read our Disclaimers.

Inside the S&P 500: The Dividend Aristocrats

Contributor Image
David Blitzer

Former Managing Director and Chairman of the Index Committee

S&P Dow Jones Indices

Dividends are ever-popular with investors, but owning dividend stocks or an ETF which tracks an index focused on dividends comes with one big worry: will the companies continue to pay dividends?  One of the surest signs that a stock is about to collapse is when the company announces it is reducing or eliminating the dividend.  While there is no way to guarantee that a stock will continue paying dividends, many investors look to the company’s past history for some hint of what it might do in the future. For those investors, a long history of consistent payments – or better yet, consistent dividend increases – is appealing.

The thought that a long history of increasing dividends could identify companies that would make an attractive dividend focused index is the idea behind the S&P 500 Dividend Aristocrats. Companies included in the index must have a history of at least 25 years of increasing dividends and be current members of the S&P 500. (They may not have been in the S&P 500 for all 25 years). Currently there are 53 stocks in the index, including some well-known names such as ExxonMobil, Walmart, Coca-Cola and PepsiCo.

Recognizing that past performance is not a guarantee of future results, one can see the past results compared to the S&P 500.  The chart shows monthly data for the S&P 500 and the S&P 500 Dividend Aristocrats, both measured as total return indices rebased to January 1990=100.

Further recognition was received when the S&P 500 Dividend Aristocrats index was named the Index Product of the Year 2014 at the William F. Sharpe Indexing Achievement Awards at the annual IMN Global Indexing and ETF Conference earlier this week in Scottsdale, AZ.

The posts on this blog are opinions, not advice. Please read our Disclaimers.

A Keynesian Puzzle for Fed Watchers

Contributor Image
David Blitzer

Former Managing Director and Chairman of the Index Committee

S&P Dow Jones Indices

The Wall Street Journal and Bloomberg surveys both report that Fed watchers and economists continue to expect the Fed to raise interest rates beginning in mid-2015.  There is enough widespread agreement that the Fed will move on interest rates next year that some forecasters now predict that the Fed’s next policy statement will drop the phrase “for a considerable period of time” when describing how long rates will remain at current levels. At the same time, a few Fed officials and regional Fed bank presidents have commented on whether the Fed should raise rates very soon, or much later, than the consensus guess of next July.

The FOMC or Federal Open Market Committee, the Fed’s policy making and rate setting group, can move very quickly when necessary.  Each time the FOMC meets it sets its interest rate targets for the six to eight weeks until the next meeting. While the Committee publishes long term projections for the economy and discusses how conditions will change over the next year or more, its time horizon for interest rates is no longer than the time to the next meeting.  When conditions warrant, it will gather by phone to decide and act quickly. Forecasting what the Fed will do next July depends on what the economy will look like next July, not what it looks like now.

However, forecasting the Fed’s likely action six months into the future is even more complicated that just predicting what the economy will be six months forward. In his  General Theory of Employment, Interest and Money, Keynes describes the forecasting problem facing stock market investors; the same problem confronts Fed watchers.  Keynes describes a fictional beauty contest run by British newspapers where subscribers are asked to choose the contestants who will be judged most attractive by the largest number of subscribers rather than the contestant each individual subscriber perceives as most attractive: forecasting the forecasts of others.   Fed watchers need to forecast what each voting member of the FOMC will be forecasting for the economy next July.  To make the challenge a little worse, there are two open seats on the Federal Reserve Board which might be filled by July.

Most analysts and economists commenting on the Fed have a lot of experience divining the central bank’s next move, so one would hope that they would be right more often than not.  The additional concern is that current economic conditions are rather unusual and history is probably a flawed guide to the immediate future.  Economic growth is strong enough to promote substantial job creation and push down the unemployment rate.  This is all good and is a reason for the Fed to consider raising interest rates. At the same time, inflation is surprisingly low (1.5% on the CPI), the dollar is gaining strength compared to almost every other currency and may dampen demand for US exports already threatened by slow or slowing growth in most other parts of the world.  On top of all that, oil prices have plunged and oil drillers are announcing cuts in their 2015 capital spending plans. All these factors argue for holding the line on interest rates.

What is the Fed likely to do? Wait and see – no reason to rush into 2015 since the FOMC will have more hard facts about the economy if it waits awhile.  But that won’t help Fed watching analysts who are expected to tell now when the Fed will raise interest rates.

The posts on this blog are opinions, not advice. Please read our Disclaimers.

Low Chinese CPI: A Commodity Catalyst?

Contributor Image
Jodie Gunzberg

Former Managing Director, Head of U.S. Equities

S&P Dow Jones Indices

Following weak Chinese economic data, several headline stories broke about commodities crashing although the only sectors with consistent losers are energy and grains.  One news story stated, “Copper prices resumed their decline on Wednesday, after data showed that inflation in China slowed to the lowest level in five years, underling concerns over a slowdown in the world’s second largest economy.”

This might seem backwards given the CPI is a reflection of historical prices rather than an expectation of future prices. However, despite Dr. Copper’s lack of smarts and historical evidence showing very little predictive ability of copper prices on GDP growth not only from China but around the world, maybe Chinese CPI holds a secret about the behavior of commodity prices. The chart below shows Chinese CPI yoy% versus the S&P GSCI Gold, Copper and Petroleum. It is no surprise to see a relationship between Chinese CPI and supposedly economically sensitive commodities, copper and oil.

Source: S&P Dow Jones Indices LLC. All information presented prior to the index launch date is back-tested. Back-tested performance is not actual performance, but is hypothetical. The back-test calculations are based on the same methodology that was in effect when the index was officially launched. Past performance is not a guarantee of future results.  Please see the Performance Disclosure at http://www.spindices.com/regulatory-affairs-disclaimers/ for more information regarding the inherent limitations associated with back-tested performance.

CPI (Consumer Price Index), despite the region, is a measure of prices of a basket of goods. It makes sense to see a relationship between commodity prices and CPI since the same food and energy that is in CPI is in the commodity indices.  Given the energy price drop, the lower than expected Chinese CPI shouldn’t be much of a surprise, but if it is a surprise, it might not be a negative surprise for the future of commodity prices.

A slowdown in Chinese inflation could be a catalyst for commodities if the chance of rate cuts and monetary easing increases. Historically back to 1999, the S&P GSCI Petroleum has had a generally positive correlation to Chinese CPI.

Source: S&P Dow Jones Indices LLC. All information presented prior to the index launch date is back-tested. Back-tested performance is not actual performance, but is hypothetical. The back-test calculations are based on the same methodology that was in effect when the index was officially launched. Past performance is not a guarantee of future results.  Please see the Performance Disclosure at http://www.spindices.com/regulatory-affairs-disclaimers/ for more information regarding the inherent limitations associated with back-tested performance.

If Saudi continues to pump oil to hold its market share, then maybe oil has further to drop (and Chinese CPI) but since the troughs of Chinese CPI, commodities have performed well. The chart below shows the time periods of trough negative Chinese CPI to peaks in history with generally large returns of commodities following the low inflation. On average in these three periods, the S&P Gold, Copper and Petroleum returned 33.3%, 55.6% and 101.6%, respectively.

China CPI Returns

Source: S&P Dow Jones Indices LLC. All information presented prior to the index launch date is back-tested. Back-tested performance is not actual performance, but is hypothetical. The back-test calculations are based on the same methodology that was in effect when the index was officially launched. Past performance is not a guarantee of future results. Please see the Performance Disclosure at http://www.spindices.com/regulatory-affairs-disclaimers/ for more information regarding the inherent limitations associated with back-tested performance.

The posts on this blog are opinions, not advice. Please read our Disclaimers.