The low volatility effect in equities refers to the findings that stocks that previously exhibited lower realized volatility outperform those with higher volatility as well as the broad based market on a risk-adjusted basis. It has been well documented in academic and practitioner research, and we have also seen widespread adoption in investment product offerings in the market. The success of the low volatility strategy prompts the question of whether the low volatility effect exists in other asset classes or sectors. This blog extends the study of the low volatility effect to U.S. preferred stocks.
We used the S&P U.S. Preferred Stock Index to represent the U.S. preferred stock universe, the opportunity set. The index’s first value date is in September 2003, and its universe expanded significantly in October 2010 due to the methodology change that removed the limit to the number of lines of a single company’s preferred stock allowed in the index. Therefore, we present our analysis for pre-2010, post-2010, and the full period separately, emphasizing the post-2010 period due to the increase in the size of the universe.
To study the efficacy of the volatility factor in the preferred market, we divided the index universe into quartiles by preferred stocks’ realized volatility over the past year (for empirical evidence on why realized volatility was used, please refer to “Can Realized Volatility Predict Future Volatility for Preferred Securities?”). The quartile portfolios were rebalanced on a monthly basis and equally weighted.
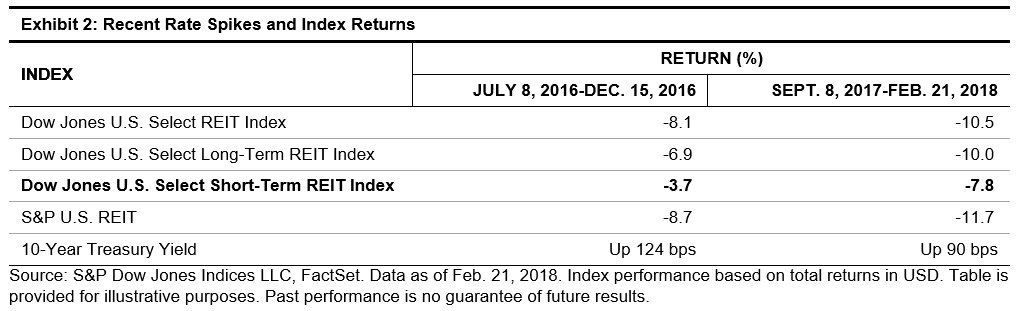
Exhibit 1 shows the risk/return profile for the quartile portfolios and the broad market universe[1] in the three time periods. As expected, the least volatile quartile had the lowest volatility across all three time periods with the opposite observed for the most volatile portfolio. Furthermore, the two least volatile quartiles exhibited lower volatility than the broad market universe. Similar to the findings in equities, the results confirm that ex-ante ranking of preferred securities by realized volatility is effective in predicting ex-post volatility.
On the other hand, return variation among the quartiles was not as linear or monotonic. For example, in the post-2010 period, return increased from the lowest volatility quartile to the second and third quartile, but then decreased for the highest volatility quartile. For the full time period, the highest volatility quartile delivered the lowest accumulated return among the quartile portfolios. Risk-adjusted returns, calculated as the ratio of return to volatility, was the highest for the least volatile portfolio, and decreased consistently from the low volatility to high volatility quartiles in all three observation periods. The least volatile portfolio also had a higher risk-adjusted return than the broad market.
Our analysis indicates the potential of a low volatility factor strategy in reducing return volatility in U.S. preferred stocks. In particular, the highest volatility quartile consistently exhibited the highest return volatility, while not compensating for that higher risk with extra return, and therefore resulting in significantly lower risk-adjusted returns.
[1] The broad market universe is represented with S&P U.S. Preferred Stock Index modified with equal weight to facilitate comparison here.
The posts on this blog are opinions, not advice. Please read our Disclaimers.