Get Indexology® Blog updates via email.

In This List

Results from the Recent S&P 500 Net Zero 2050 Paris-Aligned Sustainability Screened Index Rebalance

Style Chicken or Sectoral Egg?

SPIVA and the Case for Indexing

Celebrating 20 Years of the S&P 500 Equal Weight Index

Do Friendly Bears Exist?

Results from the Recent S&P 500 Net Zero 2050 Paris-Aligned Sustainability Screened Index Rebalance

Contributor Image
Narottama Bowden

Director, Sustainability Indices Product Management

S&P Dow Jones Indices

The author would like to thank Clara Arganaraz, Index Manager of the S&P 500® Net Zero 2050 Paris-Aligned Sustainability Screened Index, for her contributions to this post.

S&P Dow Jones Indices recently completed the rebalancing of all indices that aim to meet the minimum requirements for EU Climate Transition and EU Paris-Aligned Benchmarks.1 This includes the rebalancing of the S&P 500 Net Zero 2050 Paris-Aligned Sustainability Screened Index, which is designed to measure the performance of eligible equity securities from the S&P 500, selected and weighted to be collectively compatible with a 1.5ºC global warming climate scenario at the index level, among other climate, environmental and sustainability objectives.

The index is designed to achieve a variety of ESG objectives through the use of sustainability screening in its eligibility criteria and an optimization process in constituent selection and weighting, including a reduced overall greenhouse gas (GHG; expressed in CO2 equivalents) emissions intensity compared to its underlying index (the S&P 500) by at least 50%. The index also includes a minimum self-decarbonization rate of GHG emissions intensity in accordance with the associated trajectory implied by the Intergovernmental Panel on Climate Change’s (IPCC) most ambitious 1.5ºC scenario, equating to at least a 7% GHG intensity reduction on average per year.

As of the index’s Nov. 30, 2022, rebalancing reference date (and all previous rebalances), the index’s enterprise value including cash (EVIC) inflation-adjusted weighted-average carbon intensity (WACI)2 achieved its required level of decarbonization—the minimum of either half the S&P 500 WACI or its 7% self-decarbonization trajectory WACI as at the rebalance reference date. The index achieved a relative decarbonization to the underlying index of 58.80% at an EVIC inflation-adjusted WACI at the required level (104.66).

The index seeks to achieve a variety of other objectives simultaneously, and once more, was able to achieve them successfully at the recent rebalance.

  • The index’s weighted-average 1.5˚C Climate Transition Pathway Budget Alignment4 was marginally below zero, implying the index is 1.5˚C Climate Scenario-aligned at the index level.5
  • The index’s weighted-average S&P DJI Environmental Score achieved the minimum level required at this rebalance (72.45) based on this constraint in the methodology, also exceeding the score of the underlying index (65.65).
  • The index’s high climate impact sectors revenues exposure was at least as high as in the underlying index, as required by the minimum standards for EU Climate Transition Benchmarks and EU Paris-aligned Benchmarks.
  • The index had a lower exposure to companies deemed to insufficiently disclose their GHG emissions, at a level well below its maximum exposure permitted by the methodology.
  • The index did not have any exposure to companies with fossil fuel reserves, despite the methodology permitting a maximum of 20% of the exposure of the underlying universe.
  • The index-level physical risk score (31.74) was at the required level as of the rebalance, as defined by the methodology, and it was lower than the underlying index’s score (35.27).6

The index’s ratio of green revenues to brown revenues was four times higher than in the underlying index, as required by the methodology.

The S&P 500 Net Zero 2050 Paris-Aligned Sustainability Screened Index seeks to achieve a range of climate change, environmental and sustainability objectives, and again the index has met these ambitions.

1 Commission Delegated Regulation (EU) 2020/1818 of 17 July 2020 supplementing Regulation (EU) 2016/1011 of the European Parliament and of the Council as regards minimum standards for EU Climate Transition Benchmarks and EU Paris-aligned Benchmarks. https://eur-lex.europa.eu/legal-content/EN/TXT/PDF/?uri=CELEX:32020R1818&from=EN

2 Measures are calculated in metric tons of carbon dioxide-equivalent emissions per USD 1 million of EVIC (tCO2e/USDmn). For more information on how this metric is calculated, see “Weighted-Average Carbon Intensity (WACI)” in the Constraint-related Definitions section of the S&P 500 Net Zero 2050 Paris-Aligned Sustainability Screened Index Methodology.

3 For more information on how the WACI is adjusted for EVIC inflation, see ‘Inflation Adjustment’ in Section 3, Part 4 of the EU Required ESG Disclosures Appendix in the S&P Paris-Aligned & Climate Transition Index Family Benchmark Statement.

4 For more information on how this metric is calculated, see the Constraint-related Definitions and Optimization Constraints sections of the S&P 500 Net Zero 2050 Paris-Aligned Sustainability Screened Index Methodology, and the S&P Dow Jones Indices: ESG Metrics Reference Guide.

5 A measure at or below zero means the index is 1.5˚C Climate Scenario-aligned at the index level.

6 A lower score is associated with less physical risk exposure at the index level.

The posts on this blog are opinions, not advice. Please read our Disclaimers.

Style Chicken or Sectoral Egg?

Contributor Image
Craig Lazzara

Former Managing Director, Index Investment Strategy

S&P Dow Jones Indices

Anyone who has perused our S&P 500® Factor Dashboard for December 2022 (and it’s a shame if you have not) will recognize Exhibit 1 below. The horizontal axis represents the difference between the weighted average value and growth scores (at the beginning of 2022) for each of the 17 factor indices in our dashboard, while the vertical axis shows each index’s 2022 performance relative to the S&P 500.

Exhibit 1 shows that the value-growth differential explained nearly 80% of the variation in performance across factor indices last year. The importance of style exposures in explaining factor index returns is unsurprising given the significant spread between Value and Growth returns in 2022. S&P 500 Value outperformed S&P 500 Growth by 24% last year, Value’s biggest winning margin since 2000, and the fourth highest since 1995.

Style scores are not the only potential explanatory variable; sector exposures can also be relevant in analyzing relative returns. Information Technology, the largest sector in the S&P 500, underperformed the benchmark by 28% in 2022, and Exhibit 2 shows the relationship between each factor index’s IT weight and its relative performance. This simple metric has even more predictive power than the spread between an index’s value and growth scores.

But sector and style exposures are not independent. In 2022, IT was the sector most underweighted in S&P 500 Value and most overweighted in S&P 500 Growth. Alternatively, of the S&P 500’s 11 sectors, IT had both the lowest weighted average value score and the highest weighted average growth score. This raises an obvious question: did IT underperform because it was expensive and fast-growing, or did Value outperform (and Growth underperform) because of their IT weightings?

We can address this question by ranking the S&P 500’s constituents by the difference between their value and growth scores, and then dividing the index into quintiles. Consider the quintile with the biggest difference between value and growth scores, a combination of cheapness and relatively slow growth. IT composed 7.4% of the weight of this quintile, and those issues represented 5.0% of the weight of the IT sector. Between 7.4% and 5.0%, there’s not much to choose.

At the opposite end of the scale—the “expensive, fast growth” or “EFG” quintile—there is a much bigger distinction. Exhibit 3 shows that IT companies represented 81% of the EFG quintile’s weight. The same “expensive, fast growth” companies made up 64% of the IT sector. In other words, the IT sector had much more exposure to non-EFG names than the EFG quintile had to companies from sectors other than IT.

On this basis, it’s fair to say that IT was more important to the expensive, fast growth quintile than members of that quintile were to the IT sector. This is a particular result rather than a general observation. At other times and with other sectors and factors, the conclusion might well be different. But in 2022, it appears that the IT sector was more important to the interplay of value and growth than that interplay was to IT.

The posts on this blog are opinions, not advice. Please read our Disclaimers.

SPIVA and the Case for Indexing

What’s driving the rise of passive investing? Take a deep dive into the active vs. passive debate as S&P DJI’s Craig Lazzara explores what two decades of SPIVA has to say about why active has historically tended to underperform passive around the world.

The posts on this blog are opinions, not advice. Please read our Disclaimers.

Celebrating 20 Years of the S&P 500 Equal Weight Index

Contributor Image
Hamish Preston

Head of U.S. Equities

S&P Dow Jones Indices

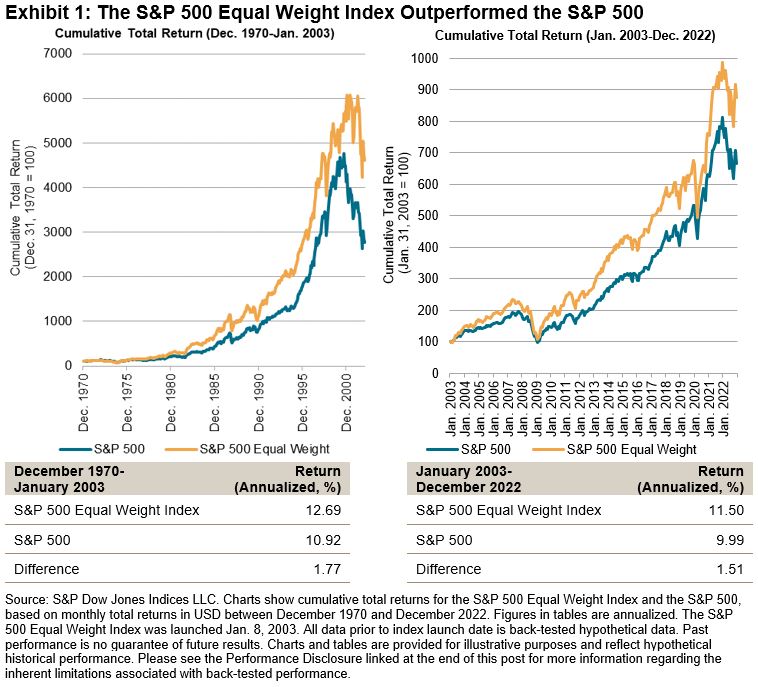
The S&P 500® Equal Weight Index launched on Jan. 8, 2003, so Sunday marked 20 years since the index first allowed investors to measure the performance of egalitarian allocations among S&P 500 constituents. The index is now tracked by various investment products globally, and it has potential benchmarking applications. Exhibit 1 shows that the S&P 500 Equal Weight Index has outperformed the S&P 500, both since January 2003 and when observing its back-tested history starting in the 1970s.

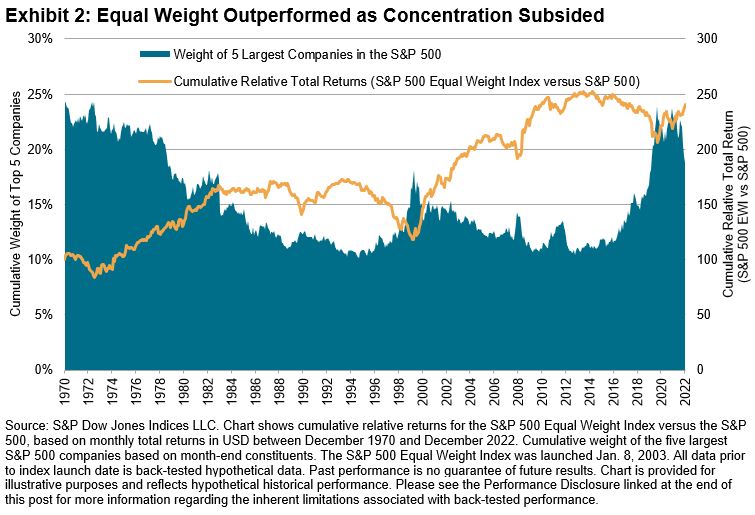
Arguably the biggest driver of the S&P 500 Equal Weight Index’s outperformance was its smaller size exposure. Having more (less) exposure to the smaller (larger) names in the S&P 500 explained over 50% of the S&P 500 Equal Weight Index’s relative returns, historically, and it was useful when exploring equal weight’s impact on risk/return. Indeed, it helped to explain the case for equal weight indexing amid the elevated concentration in S&P 500 constituents in recent years. Exhibit 2 illustrates the historical dynamic between changes in concentration and the relative performance of the equal weight index.

However, size exposure was far from the only source of outperformance in equal weight indices. For example, the S&P 500 Equal Weight Index’s anti-momentum and value factor tilts, along with its distinct sector exposures, helped it to beat the S&P 500 by 7% in 2022. More strategically, the equal weight index benefited from positively skewed equity returns: Exhibit 3 shows that for an average calendar year between 2003 and 2022, the index offered more exposure to the best-performing S&P 500 stocks.

In addition to the potential relevance of the S&P 500 Equal Weight Index to those looking for large-cap U.S. equity exposure, there are several reasons why investors may wish to use the S&P 500 Equal Weight Index as a supplemental benchmark for large-cap U.S. equity managers. For example, the equal weight index may be a more suitable benchmark, given that it appears many active managers have historically been closer to equal weighting than cap weighting in their portfolio construction. Exhibit 4 illustrates that the S&P 500 Equal Weight Index set a higher standard for large-cap U.S. equity active managers to beat over various horizons ending June 30, 2022.

The S&P 500 Equal Weight Index’s 20th birthday offers a chance to reflect on its performance, characteristics and potential use cases. Here’s to the next 20 years!

The posts on this blog are opinions, not advice. Please read our Disclaimers.

Do Friendly Bears Exist?

Contributor Image
Sherifa Issifu

Senior Analyst, U.S. Equity Indices

S&P Dow Jones Indices

“Never sell the bear’s skin before one has killed the beast.”

Jean de La Fontaine.

On Wall Street, bear markets represent declines of at least 20% from their highs. But on Main Street, bears are anthropomorphized as friendly. Here we look at whether bears can also be “friendly” in financial markets, looking at the S&P 500®’s bear markets to assess what periods of pessimism have told us, historically, and whether there may be glimmers of hope.

A tumultuous 2022 resulted in the S&P 500 entering a bear market and posting its worst calendar year performance since 2008, down 18%, bringing an end to its three-year winning streak. The picture could have been grimmer had it not been for an early rally  in October and November; the S&P 500 was down more than 25% at its worst point.  Exhibit 1 shows that the S&P 500’s reached only one all-time high during 2022 (on Jan. 3), the fewest all-time highs in a year since 2012.

Investors may be forgiven for forgetting what it feels like to be in a bear market. The S&P 500’s longest bull market, which began after 2008’s Global Financial Crisis (GFC), was followed by the shortest bear market in history. Exhibit 3 shows that the current 2022-23 bear market’s 20% decline hasn’t reached the same magnitude as the 2020 COVID-19 sell-off or 2008 GFC, which recorded declines of 34% and 57%, respectively. However, 2022’s bear market is already 11 times the length of 2020’s COVID correction.

Overall, the S&P 500’s 14 bear markets since 1928 lasted an average of 19 months and were accompanied by an average peak-to-trough performance of -38% (see Exhibit 3).

However, market participants can take one silver lining from history—the S&P 500 has typically rebounded from major drops over medium horizons. For example, Exhibit 4 shows that the S&P 500 gained an average of 15% over the three-year period following the beginning of a bear market, and the index typically exhibited a positive return. While history shows the importance of treading with caution in bear markets, a friendly reminder is that at the end of every bear market, a bull market begins and all things pass in time.

The posts on this blog are opinions, not advice. Please read our Disclaimers.