Get Indexology® Blog updates via email.

In This List

Coronaviral Correlations

The Rising Importance of ESG Data

Why the S&P 500® VIX® Short-Term Futures Index Rose More than VIX in March

Riding through Volatility with the S&P Balanced Global Bond and Equity Futures Index

Through the Turbulence, a New Breed of ESG Indices Delivers

Coronaviral Correlations

Contributor Image
Craig Lazzara

Former Managing Director, Index Investment Strategy

S&P Dow Jones Indices

Mea culpa: Roughly a month ago I used a dispersion-correlation map to describe how index dynamics can illuminate market movements.  In particular, I reported that since high dispersion seems to be a necessary condition for a bear market, and S&P 500 dispersion levels at the end of February were far below those prevailing in past declines, conditions at that time did not look like bear markets had historically looked.  Since our analysis uses a 21 trading day lookback, I providentially noted that “in 21 more days we’ll have a completely new set of observations.”

21 days have now passed, and we have a completely new set of observations.  Market dynamics have evolved with extraordinary speed, as any sentient observer knows.  Exhibit 1 shows the decline in the S&P 500 since its February 19th high, plotted against comparable data from the 2007-09 financial crisis.  The index declined 32% from its peak through the close of trading on March 20, 2020.  The comparable loss of value during the financial crisis required a full year.

Exhibit 1.  Current Decline vs. Financial Crisis

Source: S&P Dow Jones Indices. Data from Oct. 9, 2007 (blue) and Feb. 19, 2020 (orange). Graph is provided for illustrative purposes. Past performance is no guarantee of future results.

Just as values deteriorated rapidly, dispersion and correlation shifted rapidly.  Exhibit 2 plots 21-day trailing dispersion and correlation between February 19 and March 20.  The movement toward higher dispersion and higher correlation – upward and to the right – is striking.  Bear markets seem less dependent on correlation than on dispersion, and dispersion has increased dramatically.  But what’s particularly striking is today’s elevated levels of correlation.

Exhibit 2.  Evolution of Dispersion and Correlation Since the Market Peak

Source: S&P Dow Jones Indices. Data from Feb. 19, 2020 to March 20,2020. Graph is provided for illustrative purposes.

This makes fundamental economic sense, of course, since correlation measures the degree to which the components of the index move together.  A pandemic of still-unknown duration and severity can be expected to affect every business adversely.  The degree of adversity will obviously vary across industries, with some (e.g., airlines and hotels) suffering more than others (which accounts for heightened dispersion).  But almost all will move down, driving correlations higher.

Exhibit 3 makes it clear that this has happened to an unprecedented degree, as correlations within the S&P 500 reached record levels for the month ended March 20.  Students of index dynamics will not be surprised: high volatility can be expected when both dispersion and correlation are elevated.  It is hard, in fact, to find other months comparable to this one; Exhibit 3 highlights those closest to today in the upper right corner.

Exhibit 3.  Dispersion and Correlation by Month

Source: S&P Dow Jones Indices. Data from Jan. 31, 1971 through March 20, 2020. Graph is provided for illustrative purposes only.

Exhibit 4 identifies each month in which dispersion was above average and correlation was elevated (above 0.45), and asks what happened in the aftermath of the market’s reaching those levels.  There have been 11 such months since 1971; in every case the market was higher a year later, with an average gain of 24%.

Exhibit 4.  The Aftermath of High Volatility

Source: S&P Dow Jones Indices. Chart is provided for illustrative purposes only. Past performance is no guarantee of future results.

Past results legendarily do not predict future returns, and today’s correlation levels suggest that more spikes in volatility might lie ahead.  But selling stocks in environments like the present has historically meant missing out on the recovery.

The posts on this blog are opinions, not advice. Please read our Disclaimers.

The Rising Importance of ESG Data

Contributor Image
Jaspreet Duhra

Managing Director, Global Head of Sustainability Indices

S&P Dow Jones Indices

The demand from investors for environment, social, and governance (ESG) data and ESG products has never been stronger. This has triggered a growing industry of ESG data providers in the market. It is vital for S&P Dow Jones Indices (S&P DJI), when choosing ESG data providers who drive our ESG solutions to work with market-leading global practitioners. These practitioners must be able to demonstrate in-depth company analysis and robust governance structures, ensuring the quality of their data and our products.

Some investors have used ESG data in investment processes for many decades. S&P DJI launched the first-ever global sustainability benchmark, the Dow Jones Sustainability World Index[i] over 20 years ago, partnering with ESG rating specialist SAM. In recent years, the uptake in using ESG data in the investment community has been notable. For instance, the number of financial institutions signing up to the Principles for Responsible Investment has been increasing year over year, with over 2,250 signatories in 2019.[ii]

There are many drivers for this increased interest in ESG investing. One is expanding regulations, particularly in Europe. Another is more ESG data being made available to investors as a result of improving company disclosures. There is also increasing awareness and acceptance from investors regarding the financial materiality of ESG data and the role it can play in aiding investment decisions.

This momentum behind ESG investing has intersected with a trend toward passive investment, as investors continue to look for transparent, low-cost, and tax-efficient alternatives to actively managed, higher-cost products. This dual increase of money moving into passive and ESG solutions makes it essential for S&P DJI to continue to invest in quality, innovative, and deep ESG sources.

S&P DJI’s long-term partner, SAM, continues to provide us with some of the most robust ESG ratings available in the market, with a depth of company engagement that is unrivaled among its peers. The data that SAM provides us also powers our own S&P DJI ESG scores, which are used in many of our ESG indices, including our S&P ESG Index Series launched in 2019.[iii]. SAM was acquired by S&P Global in January 2020. In our recent webinar—Using ESG Data to Simplify the Complex—Manjit Jus of SAM explored how ESG data sets can be used in ESG indices.

Climate is often the top issue for investors when considering ESG issues. This has long been recognized by S&P DJI, as we launched the S&P Global Carbon Efficient Index Series back in 2009. In developing our carbon-efficient indices, we sought to partner with a high-quality global carbon data provider, ultimately selecting Trucost (part of S&P Global since 2016). Trucost provides us with a wide range of climate metrics that enable us to create the breadth of climate indices demanded by investors. It has proven to be at the forefront of climate innovation by regularly launching new climate data sets as investor needs evolve. For instance, in developing an index concept that aligns with requirements of the EU climate benchmark regulations, we rely upon several innovative Trucost datasets, including global scope 3 data, physical risk datasets, and transition pathway data.[iv]

Our offerings provide access to the highest-quality ESG data and ESG indices, utilizing the in-house research of SAM and Trucost, both of which are part of S&P Global. This, coupled with our lengthy history of providing independent and transparent indices, positions us well to supply the broad suite of high-quality ESG index solutions increasingly required by the market.

You can learn more about the vital role of data in ESG indices in the replay of our recent webinar, Using ESG Data to Simplify the Complex.

[i] Dow Jones Sustainable Index https://spdji.com/indices/equity/dow-jones-sustainability-world-index

[ii] PRI 2020, About the PRI https://www.unpri.org/pri/about-the-pri

[iii] S&P 500 ESG Index https://spdji.com/indices/equity/sp-500-esg-index-usd

[iv] Conceptualizing a Paris-Aligned Climate Index for the Eurozone https://www.spglobal.com/en/research-insights/articles/conceptualizing-a-paris-aligned-climate-index-for-the-eurozone

The posts on this blog are opinions, not advice. Please read our Disclaimers.

Why the S&P 500® VIX® Short-Term Futures Index Rose More than VIX in March

Contributor Image
Berlinda Liu

Former Director, Multi-Asset Indices

S&P Dow Jones Indices

Markets are down over 20%, COVID-19 is a global pandemic, negative global growth is looming—all of that just in the first 20 days of March! During same time period, VIX rose 65%, while the S&P 500 VIX Short-Term Futures Index jumped 175%. With a long-term beta of 0.7 to spot, a question might be—why did the S&P 500 VIX Short-Term Futures Index jump more than the spot?

The reason for this is that March was a time for catching up. In February, the spot jumped 113%, while the front two months’ futures lagged, rising 44% and 30%, respectively, thereby leading to a 134% and 146% respective catch-up in March.

Now, interestingly, the S&P 500 VIX Short-Term Futures Index, an unleveraged hypothetical basket of the first two VIX futures contracts, returned more than either of its constituents. This is because of “roll yield” due to the curve being in backwardation—where rolling an expensive first month to a cheaper second month adds to returns. VIX has been backwardated since Feb. 24, 2020, as shown in an earlier blog.

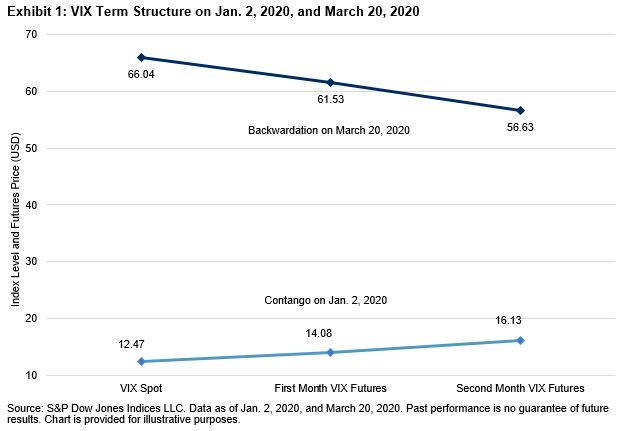
Exhibit 1 shows the VIX term structure on Jan. 2, 2020 (in contango) and on March 20, 2020 (in backwardation). In the first case, the S&P 500 VIX Short-Term Futures Index sold first-month futures at USD 14.08 and bought the same second month portion at USD 16.13, incurring a per-unit roll cost of USD 2.05. While on March 20, 2020, the daily roll of the index would sell higher at USD 61.53 and buy lower at USD 56.63, thus enjoying a per-unit profit of USD 4.90. Since VIX futures were backwardated for almost a month, this additional roll return was not negligible.

If a VIX futures gradient on a given day is quantified as its slope between the first- and second-month contracts, a positive slope (or a contango) amounts to a roll cost, while a negative slope (or backwardation) yields a roll carry.

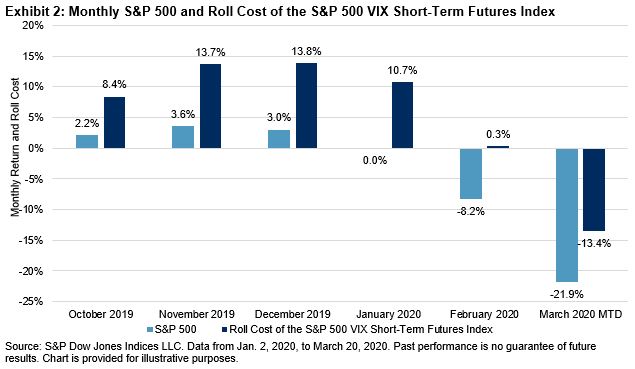
Further, we define monthly average VIX futures gradient as the average of daily slopes during that month. Since the S&P 500 VIX Short-Term Futures Index rolls continuously, this is essentially the actual monthly roll cost. A positive number indicates cost, while a negative number indicates roll yield. Exhibit 2 shows that the daily roll in the first 20 days of March contributed a positive return of 13% to the index return.

Exhibit 3 shows that the negative correlation between the S&P 500 VIX Short-Term Futures Index and the S&P 500 is stronger in a bear market than in a bull market. Interestingly, the correlation between its monthly roll cost and the equities market is also much stronger when the market goes down (see Exhibit 4). Thus, in a stressed market, it is more likely that the VIX futures term structure will be backwardated and investors will benefit from the daily roll of the index.

Vladimir Lenin said, “There are decades where nothing happens; and there are weeks where decades happen.” While the market has faced unprecedented pressure from a pandemic, the S&P 500 VIX Short-Term Futures Index has generated positive returns from the elevated VIX level and the roll yield from the VIX futures term structure. Backwardation is uncommon, but it has come to the rescue when it was needed most.

The posts on this blog are opinions, not advice. Please read our Disclaimers.

Riding through Volatility with the S&P Balanced Global Bond and Equity Futures Index

Contributor Image
Izzy Wang

Senior Analyst, Factors and Dividends

S&P Dow Jones Indices

The S&P Balanced Global Bond and Equity Futures Index (the S&P BEF Index) is designed to deliver consistent returns through various market cycles by exploiting the complementarity between equities and bonds during market crisis, and adjusting the allocation to component indices on a daily basis to achieve a stable risk level (what we call a dynamic volatility control mechanism). The components are rolled futures that are highly liquid and tradable, and are as follows.

  • Equities Basket: The S&P-500 (SPX), Euro STOXX 50 (SXSE), and Nikkei 225 (NKY) Rolling Futures.
  • Bond Basket: U.S. Treasuries, Euro Bund, and JGB Notes Rolling Futures.

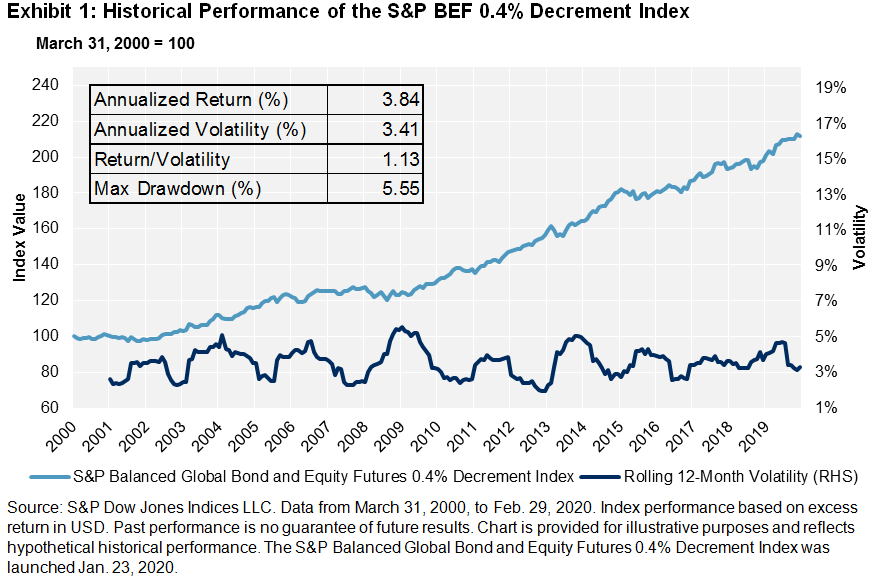
Over the past 20 years, S&P BEF 0.4% Decrement Index[1] posted an annualized return of 3.84%, a risk-adjusted return of 1.13, and a maximum drawdown of 5.55% (see Exhibit 1).

How did the index perform during historical crises?

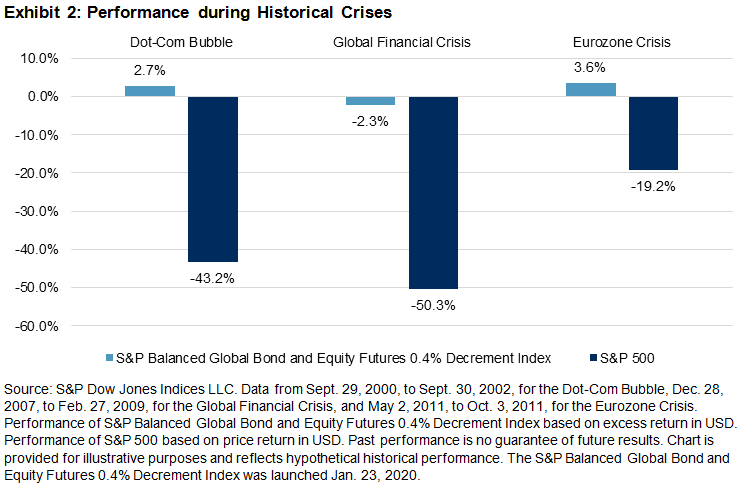
The S&P BEF 0.4% Decrement Index posted positive returns of 2.7% during the Dot-Com Bubble Crisis and 3.6% during the Eurozone Crisis. This is in stark contrast to the significant losses posted by the S&P 500® during those periods.

Throughout the 2008 Global Financial Crisis (GFC), the S&P BEF 0.4% Decrement Index declined 2.3%, while S&P 500 lost 50% during the same period. The index recovered rather quickly within six months compared with the four years that the S&P 500 took. The S&P BEF Index’s asset allocation around the GFC is shown in Exhibit 3.

  1. When the crisis began in August 2007, the leverage ratio was swiftly reduced from the high point of 140% to 120% by mainly cutting equity exposure by 20%.
  2. As the market was affected by escalated volatility, equity exposure was further reduced to 11% in March 2008.
  3. Before the bankruptcy of Lehman Brothers in September 2008, the S&P BEF Index switched to “minimum investment” mode, with merely 2.5% allocation in equities and 46% in bonds. Until February 2009, equity exposure was limited to 5%.
  4. In the recovery period, as volatility decreased, the leverage ratio gradually returned back to 113% with 95% in bonds and 18% in equities in September 2009.

How has the index performed so far in 2020?

As of March 16, the S&P BEF 0.4% Decrement Index declined 1.5% YTD and was off 3.7% since February 19. In comparison, the S&P 500 plunged by 26% and 29.5%, respectively.

Similar to what happened in the GFC, the S&P BEF Index first reacted to the increasing volatility in the stock market by cutting its equity allocation from 40% on January 15 to 20% on February 28, while maintaining the bond allocation at its maximum of 100% (see Exhibit 4). During this period, bond market soared and the strategy benefited from that.

After oil prices crashed and COVID-19 was escalated to a pandemic, Treasuries started to fall on March 9 as well. To tackle the widespread volatility, the S&P BEF Index turned on “minimum investment” mode by significantly reducing allocations to both equity and bond baskets. As of March 16, 2020, the index had only 5.4% equity exposure and 63.8% bond exposure. The leverage would further decrease if the market situation worsened.

What is special about the current market environment is that the levels of volatility varied among major regions, potentially because of the different phases of virus spread. Throughout January, we saw greater volatility in Europe and Japan than in the U.S. And during this period, the index assigned an average allocation of 17.3% to S&P 500 futures, greater than the 11.5% allocated to the Euro Stoxx 50 and the 9.2% allocated to the Nikkei 225 (see Exhibit 5). By March 16, allocation to the three regional equity indices changed to 1.8% for S&P 500, 1.4% for Euro Stoxx 50, and 2.2% for Nikkei 225. Likewise, when a certain market’s volatility starts to come down, the risk control mechanism will be able to dial up the allocation to that specific region in the future.

The S&P BEF Index aims to deliver higher long-term risk-adjusted returns with a smoother wealth curve than a single asset might. Historically, it rode through the Dot-Com Bubble, 2008 GFC, and Eurozone Crisis. In 2020, the S&P BEF Index has worked well so far.

[1] The S&P BEF 0.4% Decrement Index tracks the S&P BEF Index less a fixed fee of 0.4% per year.

The posts on this blog are opinions, not advice. Please read our Disclaimers.

Through the Turbulence, a New Breed of ESG Indices Delivers

Contributor Image
Reid Steadman

Former Managing Director, Global Head of ESG & Innovation

S&P Dow Jones Indices

Have the new beta-like ESG indices delivered on their objectives, notwithstanding the market turmoil? The answer is yes, and then some. The S&P 500® ESG Index has provided low tracking error relative to the S&P 500 and similar risk, but also a better return.

For decades, growth in ESG investing was unremarkable, held back by investors’ fears that they were inviting underperformance relative to the market by integrating their values into their investments. However, in 2019, assets in ESG funds suddenly spiked. In ETFs alone, assets increased from USD 22.1 to USD 56.8 billion.[1] What brought this about? The launch of popular new indices, like the S&P 500 ESG Index, which were built to maintain overall industry group weights characteristics similar to those of their underlying benchmarks.

These beta-like indices gave investors’ comfort that they could integrate ESG into the core of their portfolios. Was this warm feeling deserved? As Exhibit 1 shows, the ESG versions of the S&P 500, S&P Europe 350®, S&P Global LargeMidCap, and S&P Developed LargeMidCap indices all performed better than their beta counterparts. The only major category in which the ESG version underperformed was emerging markets.

Because these indices are new, however, it is important to acknowledge that three- and five-year return figures include history that was built before these indices launched in early 2019, as noted in the methodology. For this reason, investors should pay special attention to the past year or so, when the indices were live. As Exhibit 2 highlights, the ESG indices have posted low returns, in line with the market, but the ESG versions have mostly outperformed beta, with the S&P 500 ESG Index beating the S&P 500 by 100 bps YTD. Again, only the S&P Emerging Market LargeMidCap ESG Index underperformed its beta peer.

What produced these results? Simply put, it was how the index methodology sorted the largest companies that drove performance.

To recap our standard ESG index methodology, it was designed to retain most companies in the benchmark index, weighting those that remain by market capitalization. Companies are excluded only if they: (a) have a low ESG score relative to their industry peers; (b) are involved in controversial weapons or tobacco production or sales; (c) are not closely adhering to the UN Global Compact; or (d) are involved in severe controversies.

Because the index is market capitalization weighted, the ESG index methodology has to properly sift the largest companies for the ESG benchmark to perform in line with its objective. In this respect, the 2019 rebalance seems to have largely been on the mark. Some companies that were significant drivers of the S&P 500’s performance in the past 12 months, such as Apple and Microsoft, passed through the screens and remained in the S&P 500 ESG Index. Other major companies with less-than-stellar performance, such as Boeing, were excluded.[2]

Will the S&P 500 ESG Index continue to track and even improve on the performance of the S&P 500 in the future? Common sense and our lawyers prevent us from speculating, but it appears that the ESG indices are passing major tests—their first year live, their first rebalance, and their first bout with market volatility—even better than expected.

[1] Source: S&P Dow Jones Indices.

[2] Boeing was excluded from the S&P 500 ESG Index because of its involvement in controversial weapons.

The posts on this blog are opinions, not advice. Please read our Disclaimers.