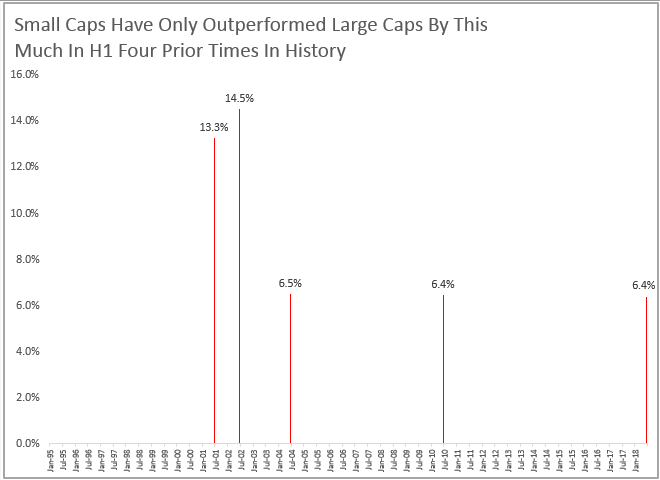
Small caps are outperforming large caps (S&P 600 (TR) – S&P 500 (TR)) in H1 2018 by the most in eight years, since H1 2010, from growing concerns over rising tariffs and general U.S. foreign trade policy. In the past four months, the smaller companies have outperformed larger companies by 10.1%, contributing to the 5th biggest realized small cap premium in the first half of any year in history.
The smaller cap stocks are less sensitive to international relations generally from the higher percentage of revenue generated in the U.S., though they are still impacted by sector fundamentals and the percentage of exports of foreign output since the U.S. economy is largely driven by consumer spending. Overall, U.S. small caps in the S&P 600 generate nearly 80% of revenue domestically, whereas U.S. large caps in the S&P 500 only generate just over 70% domestically. However, this varies by sector which can explain some of the small cap premium.
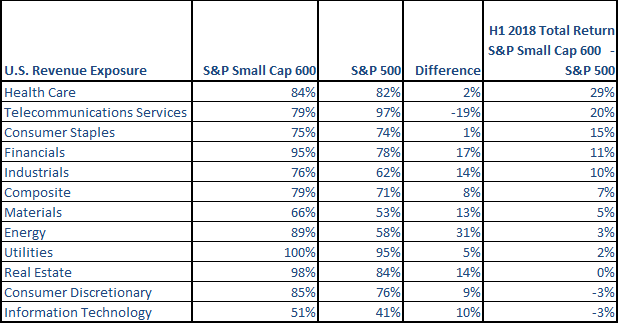
For some sectors like financials and industrials that are showing relatively large small cap premiums, the revenues generated from the U.S. are significantly higher for small caps. For example, financials have 17% more of revenues coming domestically, driving the small caps to outperform by 11% year-to-date through Jun. 29, 2018 that has been helped by rising interest rates, growth, inflation and the rising dollar. Historically, financials have done best with GDP growth of any sector, rising on average 6.9% for every 1% rise in GDP growth.
Industrials, one of the sectors that may be most impacted by fears of tariff and trade, also have a relatively greater portion of revenues, 14% more, coming domestically for small caps than large caps. The rising dollar increases the small cap industrials 84 basis points on average for every 1% dollar increase, whereas the large caps only rise 67 basis points for the same dollar move. Also for every 100 basis point rise in interest rates, the small cap industrials have risen 8.6% on average versus just 4.8% for large cap industrials. The result has been a 10% small cap premuim for the sector this year.
However, for some sectors like health care, consumer staples and energy, the industry fundamentals have been more powerful for the small cap outperformance than the percentage of revenues coming domestically for the small caps versus the large caps. For example health care and consumer staples each has nearly the same percentage of revenues generated domestically as internationally but the small cap premiums have been high of 29% and 15%, respectively. Small health care companies are outperforming large caps in health care from increased expectations for acquisition of smaller companies, stronger innovation from smaller companies and that smaller companies may be more immune to concerns about regulatory pressures in healthcare. Also in energy, the performance between sizes has been nearly even despite the gains in oil price. This is since oil hedging by the larger companies is more prevalent than in smaller companies, offsetting some of the gains from the rising oil and domestic tailwinds.
Additionally, consumer staples have shown a strong small cap premium despite similar portions of revenue generated domestically despite size. This seems to be driven mainly by fear of uncertainty in the market, making it the second best performing small cap sector in June. It outperformed the more economically sensitive consumer discretionary sector in two consecutive months for the first time since July and Aug 2017, and the small cap consumer staples have been outperforming the small cap consumer discretionary by 11.2% more than the large cap consumer staples have been outperforming the large cap consumer discretionary. This is the biggest consumer staples -discretionary differential between the sizes in a quarter since Q2 2001, and the most in 3 months since the period ending in Nov. 2015. Some may view this as a bearish signal.
Moreover, the consumer staples rise more historically with rising rates than consumer discretionary does considering more expensive financing for consumers as they make optional purchases. For every 100 basis points rise in rates, the small consumer staples rise on average 7.2% versus just 2% for large caps, and the consumer discretionary small caps rise 6.2% on average as compared to the 5.5% gain in the large caps on average. The large cap consumer discretionary sector is one of the few sectors that consistent outperforms its small cap counterpart, likely helped by the purchasing power of large companies in the sector that may be adversely impacted by higher tariffs or trade restrictions.
Lastly, in June seven of the sectors added onto their small cap premiums for total returns of 0.6% for the S&P 500, 1.1% for the S&P Small Cap 600 and 0.4% for the S&P Mid Cap 400 for the month. This added onto the year-to date gains of 2.6% for the S&P 500, 9.4% for the S&P Small Cap 600 and 3.5% for the S&P Mid Cap 400, and again widening the small cap premium this year to the 5th biggest ever.

The posts on this blog are opinions, not advice. Please read our Disclaimers.