Get Indexology® Blog updates via email.

In This List

When Will This Oil Contango End?

Try a TIPS Mixer in Your Equities Cocktail

The Dow Quickly Takes a Long Time to Hit 20,000

The New Generation of Green Investors

When Quant and Qual Become One

When Will This Oil Contango End?

Contributor Image
Jodie Gunzberg

Former Managing Director, Head of U.S. Equities

S&P Dow Jones Indices

Today “oil jumps to a nearly 3-week high as output cuts take hold” as March West Texas Intermediate crude CLH7, +1.82%  rose $1.03, or 2%, to settle at $53.78 a barrel on the New York Mercantile Exchange—the highest settlement since Jan. 6. The S&P GSCI Crude Oil (Spot Return) is now positive in 2017 through Jan. 26, up 0.1%.  However, the S&P GSCI Crude Oil Excess Return that includes the rolling return is down 1.5%.  In fact, from the bottom of the S&P GSCI Crude Oil (Spot Return) on Jan. 20, 2016, it has gained 89.7% but the S&P GSCI Crude Oil Excess Return has only gained 9.4%.

Source: S&P Dow Jones Indices. Daily data from Jan. 27, 2014- Jan. 26, 2017

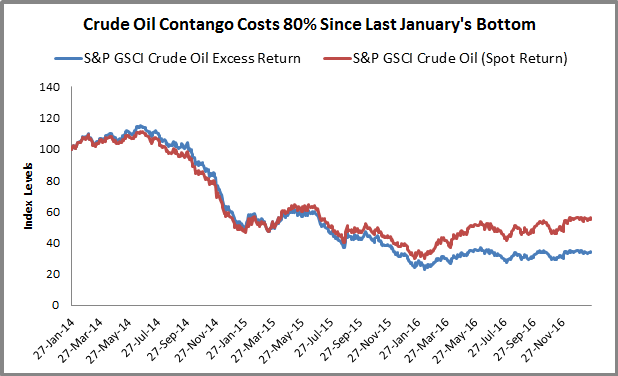
Notice though that it took until November 2014 before the spot return started outperforming the excess return after the prior peak in June 2014. That is since the cycle of backwardation and contango represent the inventory shortages and excess. Although many perceive the futures to always have a rolling cost, this is not the case and many times there is a rolling premuim.

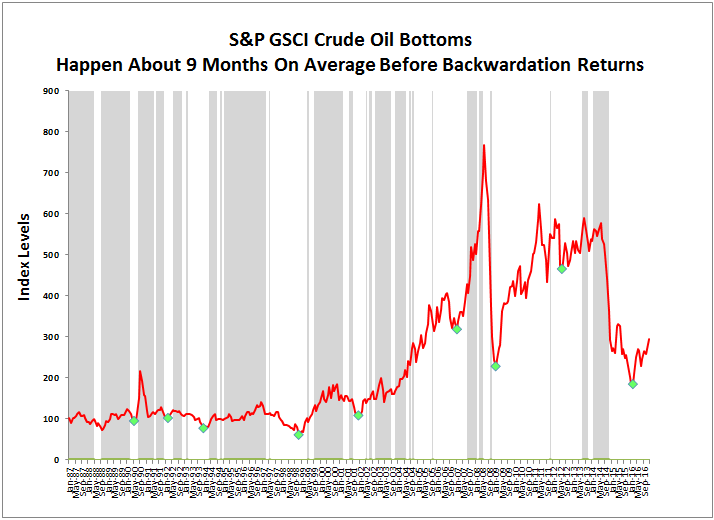
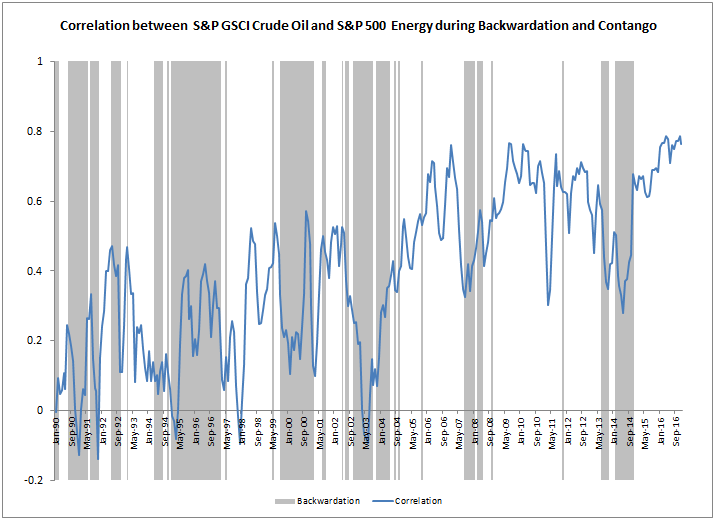
Using monthly data going back to Jan. 1987, the S&P GSCI Crude Oil has been in backwardation for 157 months and contango in 203 months, that amounts to 44% in backwardation and 56% in contango. Further the gain from backwardation is 1.7% versus the 1.5% loss from contango. Given the payoff from the positive roll from backwardation, it is worth examining when it might show up again.

Now that crude oil has been rising for nearly a year, how long after a bottom might it take before the curve switches from contango to backwardation? The answer is on average is that it takes about 9 months. Crude oil is now into a 25 month stretch of contango with 11 months since the bottom (using Dec. 2016 as the last monthly data point, though Jan. is still in contango). It is the second longest stretch in history after the 36 month period from Nov. 2008 – Oct. 2011.  Crude oil came so close to equilibrium in Oct. 2016 with a roll loss of only 92 bps, but the high production ahead of OPEC cuts increased the cost again to just over 2% in Dec, and now is already nearly 1.4% this month.

Source: S&P Dow Jones Indices. The gray background shows backwardation and white space shows contango. The red line shows index levels with green points as bottoms in periods of contango. A positive roll return of the excess return minus the spot return represents backwardation. A negative roll return of the excess return minus the spot return represents contango.

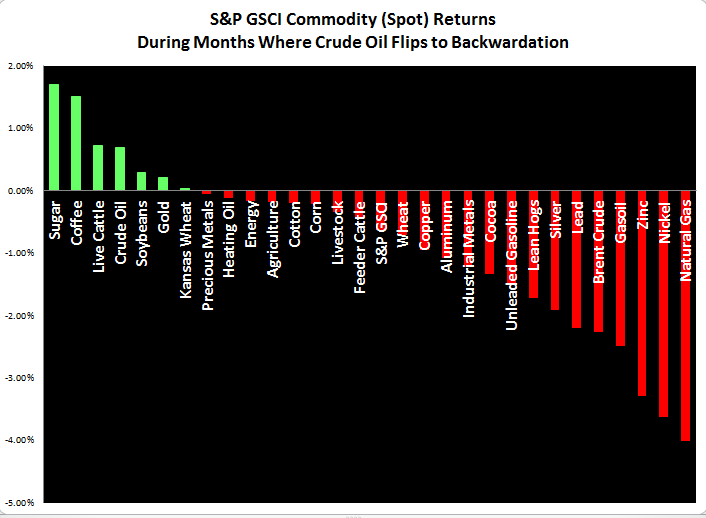
If OPEC cuts hold and inventories deplete, it is worth considering how to invest in commodities and energy equities.  While rising oil floats all commodity boats, when there is a switch in oil to backwardation from contango it may motivate more flows into oil from other commodities as evidenced by the loss for every single commodity except sugar, coffee, cattle, soybeans, gold, wheat and crude oil (of course.)

Source: S&P Dow Jones Indices

Also, a rolling 90 day correlation chart of S&P GSCI Crude Oil (Spot Return) to energy equities (S&P 500 Energy)  and the S&P GSCI Crude Oil Total Return (that includes rolling costs and collateral return) shows on average between spot and total return futures the average rolling 90-day correlation is 0.9963 but to equities is only 0.3987.  Note the correlation between crude oil and equities has risen through time, and the 90-day rolling average in just the past 10 years is 0.5951, past 5 years is 0.6027, 3 years is 0.6169 and 1 year is 0.7609.

Source: S&P Dow Jones Indices.

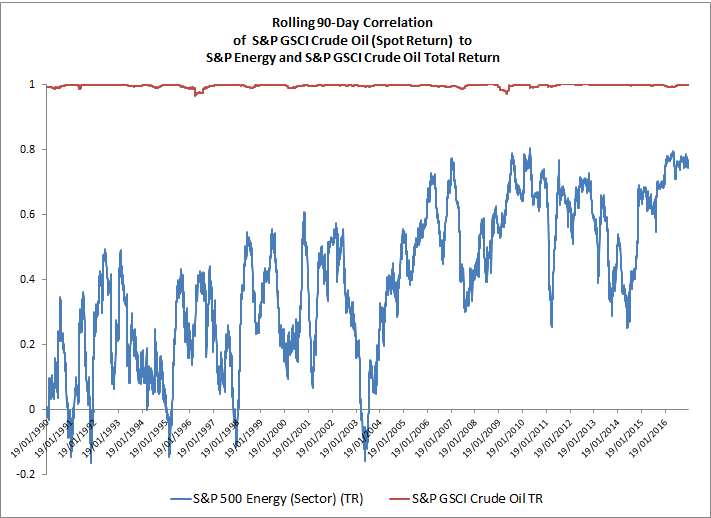
Further it is interesting that correlation between equities and oil almost double during periods of contango. On average the rolling 90-day correlation during contango is 0.4815 but during backwardation is 0.2648, showing companies may be hedging more at the wrong times.

Source: S&P Dow Jones Indices

Last, some think energy may drive the Dow Jones Industrial Average that just crossed 20,000, much higher in 2017. However, if oil increases, energy equities might be the wrong play.

The posts on this blog are opinions, not advice. Please read our Disclaimers.

Try a TIPS Mixer in Your Equities Cocktail

Contributor Image
Philip Murphy

Former Managing Director, Global Head of Index Governance

S&P Dow Jones Indices

As product manager of the S&P STRIDE Indices, I sometimes find myself extolling the virtues of Treasury Inflation-Protected Securities (TIPS), which I believe are an underappreciated asset class.  When inflation is relatively tame, people often ask why they should think about TIPS.  The answer is that TIPS don’t hedge expected inflation—that’s already priced in.  TIPS hedge unexpected inflation, and we are fortunate, because unexpected inflation is what produces particularly unpleasant circumstances if one’s portfolio does not keep up.

But hedging unexpected inflation is not the only benefit of TIPS.  They also seem to mix well with stocks. Historically, TIPS have exhibited low and sometimes negative correlations with U.S. equities.  Exhibit 1 compares the rolling 36-month correlation of the S&P 500® and the S&P 500 Bond Index (made up of corporate bonds issued by S&P 500 companies) to that of the S&P 500 and the S&P US Treasury TIPS 7-10 Year Index.  The correlation of stock returns to TIPS returns is consistently and significantly lower than the correlation of stock returns to nominal corporate bonds.

Exhibit 1: 36-Month Rolling Correlations

Capture

For the 15-year period ending December 2016, the stocks-bonds correlation of monthly total returns was 0.256, while the stocks-TIPS correlation of monthly total returns was only 0.047.  Because TIPS generally exhibit lower correlations to stocks than do nominal bonds, they may be a better portfolio diversifier.  To examine this possibility, we constructed two hypothetical portfolios, one comprising a 50/50 blend of the S&P 500 with the S&P 500 Bond Index and the other a blend of the S&P 500 with the S&P US Treasury TIPS 7-10 Year Index.

Capture

While past performance is no guarantee of future results, the benefits of lower correlation can be seen in the performance of the indices and hypothetical portfolios over the 15-year period ending December 2016.  Even though the S&P 500 Bond Index offered the best risk-adjusted return on a stand-alone basis, we see that the blend of stocks and TIPS captured most of the upside of the S&P 500 with a fraction of the volatility.  For equity market participants, getting a bit “TIPSy” may not be a bad idea.

The posts on this blog are opinions, not advice. Please read our Disclaimers.

The Dow Quickly Takes a Long Time to Hit 20,000

Contributor Image
Jamie Farmer

Former Chief Commercial Officer

S&P Dow Jones Indices

Walt Whitman said in Song of MyselfDo I contradict myself? Very well, then I contradict myself, I am large, I contain multitudes.”  Well, as does The Dow Jones Industrial Average – so I’ll present two contradictory data points from today’s record close.

First, the move from 19,000 to 20,000 was quick, happening in just 42 trading days (not calendar days, mind you).  This was the second fastest such move since the DJIA first climbed from 10,000 to 11,000 over 24 days in the spring of 1999.  The longest was from the DJIA’s May 1896 inception to the first 1,000 point level; that run took over 76 years.

Capture

On the other hand, the DJIA took its sweet time meandering through those last 100 points.  As I wrote recently in The Red Zone, the march from 19,900 to 20,000 had already taken more trading sessions than the 10 prior milestones.  In the end, it took 28 trading days to cover that ground.

Capture

Much will be written this week about this first ever close above 20,000.  One of the more common debates is the tug of war between the “psychologically important achievement” and “arbitrary milestone” camps.  I’ll leave the smart people on both sides of the divide to continue to wage that battle.  What I will assert, though, is that no other measure provides us with so much history on which to conduct that battle.  With 120+ years of performance – through expansion, recession, depression, peace-time and war – the DJIA remains an ever-reliable indicator of investor sentiment.

Finally, in transparency the Whitman quote wasn’t the first “contradictory” reference that occurred to me.  Instead, it was this rather less literate doctor’s office scene from Fletch (1985), which I’ll submit here simply because I doubt I’ll ever have any other reason to use it…

Dr. Joseph Dolan: You know, it’s a shame about Ed.
Fletch: Oh, it was. Yeah, it was really a shame. To go so suddenly like that.
Dr. Joseph Dolan: He was dying for years.
Fletch: Sure, but… the end was very… very sudden.
Dr. Joseph Dolan: He was in intensive care for eight weeks.
Fletch: Yeah, but I mean the very end, when he actually died. That was extremely sudden.

The posts on this blog are opinions, not advice. Please read our Disclaimers.

The New Generation of Green Investors

Contributor Image
Ved Malla

Associate Director, Client Coverage

S&P Dow Jones Indices

In recent years, socially responsible investing has gained importance among market participants worldwide.  There has been an increase in the number of those who have become socially conscious and want their investments to go to businesses that acknowledge the relevance of environmental, social, and governance factors to doing business.  Green investment is considered a subset of socially responsible investment that focuses on the environmental aspects of businesses.

Green investors analyze companies based on their policies pertaining to green technologies, climate change, greenhouse gas emissions, renewable energy sources, waste management, pollution control, water management, natural resource conservation, deforestation, etc.  Risks associated with these environmental aspects are looked into, and the company’s management of these risks is assessed. Green investors believe that it is important for companies to manage these risks to remain relevant in the long run.

India has aligned itself with this global trend and has become more sensitive toward the environmental aspects of doing business.  India’s decision to ratify the Paris Climate Change Agreement at the United Nations is proof that the country has become sensitized to environmental issues.  The Indian government has mandated that all companies must spend 2% of their annual net profit on corporate social responsibility activities every year.  This is a major step to promote corporate participation in social causes.  The government of India has also set an ambitious target of building 175 gigawatts of renewable energy capacity by 2022, which will require intensive fundraising.  The government alone cannot finance the green infrastructure initiatives; corporations will also have to participate and support the government on this front.  Many financial institutions and banks have already issued green bonds in India, which have been accepted well by green investors.  The Securities Exchange Board of India is also looking to come up with regulations to promote the issuance and listing of these green bonds. Government initiatives like these could help in the growth and popularity of green investments in India.

The “Green Investor Brigade” is also looking for green investment avenues in capital markets. Equity investment can have an active approach, in which the fund managers actively select companies that they consider to have relatively better green standards.  Another way is to adopt the passive route, in which investments can be made in ETFs or structured products that replicate or are linked to indices. These indices are constructed with a focus on green objectives.  Investing in index-linked products seems to be preferred globally, as leading index providers like S&P Dow Jones Indices have a scientific and rule-based methodology for selecting stocks to create these indices.  Further, passively managed products are cost effective, as they have a low asset-management fee.

The posts on this blog are opinions, not advice. Please read our Disclaimers.

When Quant and Qual Become One

Contributor Image
Emily Ulrich

Former Senior Product Manager, ESG Indices

S&P Dow Jones Indices

I’ve previously written about the convergence of typical “strategy” or “factor” indices with sustainable indices.  In 2016, we saw this rise as a trending topic in the market and we expect the interest to increase in 2017.  This multifaceted approach has been well illustrated in many aspects of our offerings, but I wanted to focus on the S&P Global 1200 Climate Change Low Volatility High Dividend Index this week.

This index series exemplifies this combination approach well, as it incorporates popular strategy methods and sustainable practices through filtering out companies with relatively higher carbon footprints, lower dividend yields, and higher volatility.

One unique aspect of this index is that it utilizes a “carbon normalized score,” which is a product of the carbon footprint (the company’s annual greenhouse gas emissions as carbon dioxide equivalent/annual revenues).

To compare this approach to another standard index, the S&P Global 1200 Carbon Efficient Select Index simply excludes the 20% of companies with the highest carbon footprint per each GICS sector.  This key methodological difference stems from the usage of absolute numbers (instead of percentages) to exclude companies with relatively high carbon intensity.  In order to capture that relativity, and to prevent the index from fully divesting from a sector (energy, I’m looking at you), it employs this “carbon normalized” process.

Exhibit 1 shows the full three-step filtering outline.

Exhibit 1: Three-Step Methodology Process

Following the low carbon selection, a high dividend overlay is applied.  This is secondary so that the final volatility screen can weed out any “value traps,” e.g., stocks that have resulted in high yields but have also experienced high amounts of volatility.

The combination of these three strategies has resulted in an index with a promising history.  As illustrated in Exhibit 2, the S&P Global 1200 Climate Change Low Volatility High Dividend Index has historically outperformed its benchmark.

Exhibit 2: Performance Chart

Looking toward the year ahead, we can expect to see factor-based investing and sustainability continue to grow as popular passive investment strategies.

The posts on this blog are opinions, not advice. Please read our Disclaimers.