Get Indexology® Blog updates via email.

In This List

The Rieger Report: 500 Index Sectors - Final 2015 Results

2015’s Rising Tide of ETFs in India

The Commodity Catastrophe of 2015

The Rieger Report: Municipal Bonds - In volatile markets boring did the job

The Rieger Report: Bonds in 2016?

The Rieger Report: 500 Index Sectors - Final 2015 Results

Contributor Image
J.R. Rieger

Former Head of Fixed Income Indices

S&P Dow Jones Indices

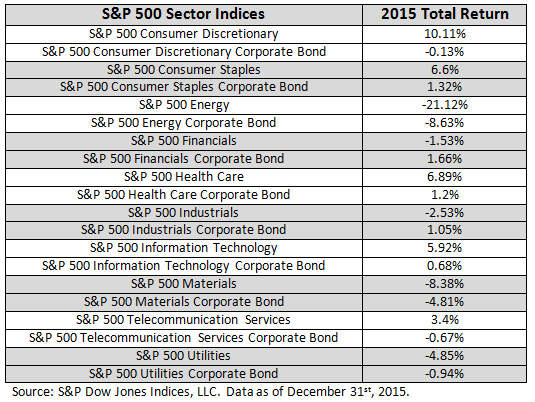
The S&P 500 Bond Index sectors creates the opportunity to examine sector performance on both the stock and bonds issued by the companies in the S&P 500 Index.   The 2015 results: As expected corporate bonds were less volatile than their equity counterparts but they still suffered from the energy and materials onslaught.

Highlights (total returns used for comparability):

  • Of the ten sectors sampled, five equity sectors saw positive returns in 2015.
  • Bonds of the five sectors with negative performance did better than equities of those sectors.
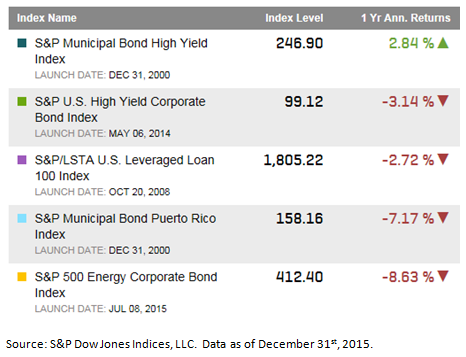
  • Energy was the biggest mover with equities down over 21% and bonds of those same companies down over 8.6%.
  • Materials was also impacted hard in 2015 with equities down over 8.3% and bonds of those same companies down over 4.8%.

Chart 1: Selected S&P 500 sector indices for stocks and bonds

Blog Sectors 1 4 2015 Chart

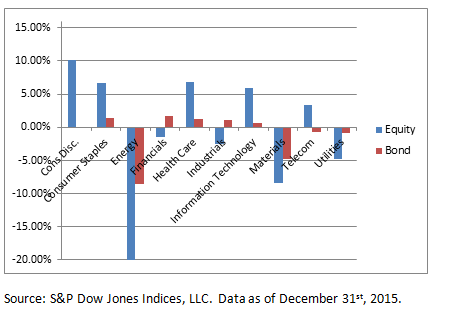
Table 1: Selected S&P 500 sector indices for stocks and bonds

Blog Sectors 1 4 2015 Table

The posts on this blog are opinions, not advice. Please read our Disclaimers.

2015’s Rising Tide of ETFs in India

Contributor Image
Koel Ghosh

Former Head of South Asia

S&P Dow Jones Indices

In October 2015, the global ETF industry witnessed its all-time high of the year, with over 6,000 ETFs and ETPs and assets reaching the USD 3 trillion mark. The year also saw month-over-month increases in inflows to ETFs, with record increases in assets across regions.  Japan led in terms of year-to-date growth, with an increase of over 200%. However, in absolute terms, the leaders have been the usual: the U.S. and Europe. As per the latest numbers for the end of November, ETFs and ETPs have gathered over USD 300 billion in net new assets, which is a record in itself.

India has not been far behind in this year’s trend in ETFs. It indeed has been an interesting year for investors in India. Who would have imagined that India’s biggest pension fund would make a foray into equities, and using ETFs as the vehicle?  Was this a positive move? It definitely seems that way! The impetus provided to the segment was tremendous and the Indian ETF industry, which had assets merely trickling in and was struggling to stay afloat, suddenly surfaced into the limelight.

At the end of March, the Indian Ministry of Labour gave notice of a new investment regulation for the Employees’ Provident Fund Organization (EPFO), which allowed investments of up to 5% of incremental income in ETFs. There was added flexibility for exempt PF trusts for which equity investment limits would be higher, and they could invest anywhere between 5%-15% of their funds in equity and equity-related instruments.

It was indeed a historic moment, and for the first time in its 64-year history, the EPFO announced its first ETF investments, in the S&P BSE SENSEX ETF and the Nifty ETF, in August 2015. This move brought some much-needed confidence in ETFs, whose advantages can include diversification, transparency, liquidity, and cost effectiveness.

The Indian ETF industry currently has 52 products with approximately USD 2 billion in assets. It is interesting to note that in 2005, there were just six ETF products, with assets not even adding up to USD 1 billion.

Exhibit 1: Global Assets in ETFs or ETPs 

Exhibit 1 - ETF

If we observe the growth of ETFs in global markets, we would see that a growth trend started in 2008, in which the number of ETFs and ETPs nearly tripled, from just over 2,000 ETFs in 2008 to over 6000 ETF and ETPs in November 2015, with assets increasing from over USD 700 billion to nearly USD 3 trillion in the same time period. While the first trillion took over a decade, the subsequent increase in assets has only taken a couple more years, which suggests a rate of exponential growth.

India seems to be on the brink of that rise, and with the new changes, positive sentiments, and the boost being provided to ETFs; we might be looking at a similar trend for the Indian markets.

The posts on this blog are opinions, not advice. Please read our Disclaimers.

The Commodity Catastrophe of 2015

Contributor Image
Jodie Gunzberg

Former Managing Director, Head of U.S. Equities

S&P Dow Jones Indices

2015 will go down in history as one of the worst years ever for commodities. The S&P GSCI Total Return lost 32.9%, posting its 4th biggest annual loss in history since 1970, and the Dow Jones Commodity Index (DJCI) lost 25.3%. Below are some notable statistics about what happened inside the indices:

2015 ended the S&P GSCI’s first 3-year consecutive loss in its history, losing a total of 55.6% during this time. 2015’s loss of 32.9% followed a similar loss of 33.1% in 2014 and a small loss of 1.2% in 2013.

Source: S&P Dow Jones Indices.
  • On Dec. 22, 2015, the S&P GSCI Total Return recorded a new maximum drawdown of -80.5% from its peak on July 3, 2008. The index on Dec. 22, 2015 was the lowest in more than 16 years, since Mar. 24, 1999.
Source: S&P Dow Jones Indices.
  • 2015 ended the S&P GSCI’s biggest 2-year consecutive loss, down 55.1%, and is only the 4th ever back-to-back annual loss. Other consecutive losses happened in 1975-76 (-17.2%, -11.9%), 1997-98 (-14.1%, -35.8%) and 2013-14 (-1.2%, -33.1%).
  • 2015 tied 2008 for a record number of negative commodities with 22 of 24 down. 20 of the 22 lost more than 10%, 13 lost more than 20%, 8 lost more than 30% and 5 lost more than 40%.

Single SPGSCI Losers 2015

  • Brent Crude lost 45.7% in 2015, the most of any single commodity. Other big losers were (WTI) Crude Oil (-45.3%), Nickel (-42.6%), Heating Oil (-41.4%) and Gasoil (-40.2%).
  • Cocoa and Cotton were the only winners in 2015, gaining 9.6% and 3.0%, respectively. Cocoa is the only commodity to have been positive in each of the past 3 years, gaining a total return of 37.5%. Interestingly, cocoa was also up in 2008, gaining 27.0% that year. Further, cocoa has only ever been down three times together with the overall index in 1991, 1998 and 2011.
  • 2015 is only the second time all five commodity sectors lost in a year. (1998 was the first.) Not only did every sector lose, but they all posted double-digit losses. Agriculture (-16.9%), Energy (-41.5%), Industrial Metals (-24.5%), Livestock (-18.3%) and Precious Metals (-11.1%). Over the past three years, their losses have been significant with about 2/3 shaved off energy, 40% each in metals and agriculture, and 10% off of livestock.
  • The S&P GSCI term structure in 2015 was the worst since 2010 and the 12th worst in history. Brent Crude posted its 4th worst roll yield, losing an additional 10.4% from contango. Natural gas lost 20.1% and (WTI) Crude Oil lost 14.9% from contango that are both severe but compared to their own histories, not as bad as brent crude’s loss.
  • For the year, six commodities contributed positive roll yield to the total return: copper, feeder cattle, lean hogs, live cattle, soybeans and unleaded gasoline.
  • Equities (S&P 500) have now outperformed commodities (S&P GSCI) for eight consecutive years that is a new record. Following the last time equities outperformed commodities for near as long in 1980-86, seven consecutive years, commodities returned almost 300% through 1990 as measured by the S&P GSCI Total Return index.

One area of concern is that recent correlation between equities and commodities has spiked, more than quadrupling since July.

Source: S&P Dow Jones Indices.

Together with the VIX (fear gauge) spike, investors may feel there is too much risk on the table and pull out of risky assets. If this happens, diversification benefits can be ruined like in the financial crisis – just when diversification was needed most.

Despite these overwhelmingly negative statistics, there have been some improvements in commodities recently that may be the start of a turnaround. In Dec., 2015, almost half of the commodities (11/24) were positive and eight were in backwardation that included feeder cattle, copper, cocoa, corn, cotton, Kansas wheat, wheat and live cattle. Also, the equity risk premium in energy signaled a bottom in Oct., 2015, El Nino and interest rates may help commodities, and again, the cycle between equities and commodities may switch. All of these may be positive for commodities going forward.

However, OPEC supply continues to be a headwind, though at some point, the demand from investors and consumers will likely pull back enough to hinder non-OPEC suppliers that may stabilize the market. Slowing Chinese demand growth and the strong dollar also haven’t helped commodities but it doesn’t seem to have impacted commodities across the board since each commodity has behaved differently and China stockpiled many commodities at cheap prices to fill reserves. The policy combined with weather make the future for commodities difficult to predict.


The posts on this blog are opinions, not advice. Please read our Disclaimers.

The Rieger Report: Municipal Bonds - In volatile markets boring did the job

Contributor Image
J.R. Rieger

Former Head of Fixed Income Indices

S&P Dow Jones Indices

The S&P Municipal Bond Index recorded a positive 3.32% total return in 2015 securing a second place finish among major asset classes.  Volatility plagued the equity and commodities markets which also tore into the corporate bond materials and energy sectors. While municipal bonds were steady throughout 2015 it had own challenges as Puerto Rico continues it’s seemingly endless financial struggles.

Table 1: Select asset class indices and 2015 total returnsBlog 1 4 2016 Table 1

Of the broader municipal bond market segments, taxable municipal bonds had the lowest returns of 1.3% while the broad revenue bond segment recorded a return of over 4%.

Table 2: Select Municipal Bond Indices, year-end yields and 2015 total returnsBlog 1 4 2016 Table 2

The S&P Municipal Bond Puerto Rico Index logged a -7.17% return in 2015 which played a significant role in muting the returns of the S&P Municipal Bond High Yield Index.  The S&P Municipal Bond Tobacco Index rebounded in 2015 with a positive 13.48% return driven by successful refundings replacing high cost debt with bonds with lower interest rates.

Table 3: Select municipal bond high yield indices, year-end yields and total returns for 2015Blog 1 4 2016 Table 3

The posts on this blog are opinions, not advice. Please read our Disclaimers.

The Rieger Report: Bonds in 2016?

Contributor Image
J.R. Rieger

Former Head of Fixed Income Indices

S&P Dow Jones Indices

2015 had been a year of low or no returns for major asset classes.  Income asset classes such as preferred stock and municipal bonds did outpace the S&P 500 Index and did so without the volatility but others did not bode as well. What about 2016? Let’s look at the leaders for 2015 first:

From a total return perspective the S&P U.S. Preferred Stock Index returned over 5.4% in 2015 with investment grade municipal bonds tracked in the S&P National AMT-Free Municipal Bond Index returning just over 3.25%.  Investment grade corporate bonds issued by ‘blue chip’ companies tracked in the S&P 500 Investment Grade Corporate Bond Index barely held even and corporate junk bonds ended in the red.  The traits of each market may give us a hint as to what 2016 may look like.

What might impact the 2016 investment grade bond market?

  • A slow rising interest rate environment is generally expected by the markets.  A change to that expectation could rattle the bond markets.  Status quo could help hold yield spreads low and prices up.
  • The high quality and relatively low volatility nature of investment grade bonds may remain attractive if the equity, commodity and junk bond markets continue to see volatility.
  • Pension funds have longed for higher yielding but quality fixed income assets to match their obligations.  That demand may help hold yield spreads in place for investment grade bonds.
  • Investment grade municipal bonds have seen steady demand and that demand has not yet been offset with a sharp rise in new debt issuance.  The supply / demand imbalance persists as we enter 2016 but could change over time if new issuance resurges.   Beyond Puerto Rico, now affecting the municipal high yield segment, headline risk is low but bears watching. Overall, the low volatility, low default rate and tax-free income of municipal bonds may all continue to contribute to keeping demand up for this asset class.
  • The investment grade corporate bond market is expecting less new issuance and some projections are for a steep drop in new issuance in 2016.  This could impact the supply / demand equilibrium and help to hold yield spreads relatively low when compared to U.S. Treasuries.  High quality and incrementally higher yielding corporate bonds may continue to draw investor interest as an alternative to U.S. Treasuries as a result.
  • Floating rate preferred stock is an asset class designed to pay dividends that rise and fall with base interest rates.  As rates go up, this may be a key driver of the asset class performance in 2016.  Demand for fixed rate preferred stock could remain strong as alternatives that offer incrementally higher yields come with increased credit risk.

Table 1: Select indices and their 2015 total returns

2015 Yr End

What might impact the 2016 ‘junk’ bond markets?

  • Yield spreads of junk bonds could widen further. This is even more dangerous to high yield bond holders than modest rate increases.  Rising corporate bond default expectations could put pressure on yield spreads pushing bond prices down on these fixed rate unsecured obligations.
  • The  energy and materials sectors have played big roles in the performance of the overall junk bond market.  Any rebound or continued depression of the price of oil could have a dramatic affect on these sectors.  The single B and CCC segments of the market have been volatile as a result.  Please refer to Table 3 for returns.
  • Senior loans tracked in the S&P/LSTA U.S. Leveraged Loan 100 Index  were down in 2015 along with their ‘junk’ bond counterparts.  Another modest rate hike will help these senior secured floating rate notes.  Generally, as rates go up these  senior loans will pay higher interest rates.  Historically, senior loans have had a lower default rate than corporate bonds.  Over the last several years, holder protections, or covenants, have been favoring the borrowers, so if defaults do rise this could impact this market. It should be noted that in a distressed situation, senior loans do get paid before unsecured debt.  In general, the senior loan asset class has lower exposure to the energy and materials sector than the fixed rate high yield corporate bond asset class.
  • Demand for yield in the municipal bond market continues to be strong. However, Puerto Rico has been a real and significant drag on performance for the bond funds that hold this paper.  Beyond Puerto Rico defaults have remained low.  The taxable equivalent yield of high yield municipal bonds vs. high yield corporate bonds may continue to give the yield advantage to municipal bonds in 2016.
  • The liquidity of the junk bond markets was tested in 2015.  It is reasonable to expect more scrutiny of the liquidity of the lowest quality segments of the junk bond markets in 2016.

Table 2: Select high yield indices and 2015 total returns

2015 HY Big Picture Yr End

Table 3: Select U.S. high yield corporate indices and their total reutrns

2015 HY Yr End


The posts on this blog are opinions, not advice. Please read our Disclaimers.