


In my last post, I introduced a series called “Weighing In:” that includes comparisons of the effectiveness of the Dow Jones Commodity Index (DJCI) and the S&P GSCI to reach certain portfolio goals. Although there are a number of reasons investors use commodities, diversification and inflation protection are the two most common.
According to Blu Putnam, Managing Director and Chief Economist, of our partner, CME Group, it may be reasonable to expect inflation later this year or in early 2015. He states concisely in a video and more in-depth in his paper, “in order for monetary policy to gain traction, the economy must be interest-rate sensitive, and this linkage is missing during a deleveraging period. We believe the US was largely over the deleveraging phase by the end 2012 or early 2013, so as the US economy becomes more interest-rate sensitive, monetary policy with near-zero short-term rates will gain traction. If economist Milton Friedman was right about the long and variable lags in monetary policy, then it is probably appropriate to start the clock at the beginning of 2013, and thus, to expect some inflation pressures 18-24 months later – late 2014 or early 2015.”
Now that we are in the second half of 2014, it may be time to start thinking about commodities as a tool for inflation hedging. It is natural to guess commodities can be used for inflation protection given the same food and energy that are in the Consumer Price Index (CPI) are in the commodity indices. However, let’s examine the impact of the composition inside the indices to determine whether the equal sector weighted DJCI or world production weighted S&P GSCI does a better job at protecting against inflation.
Notice in the chart below, the strikingly similar pattern of CPI year-over-year (yoy%), S&P GSCI yoy% and DJCI yoy%.
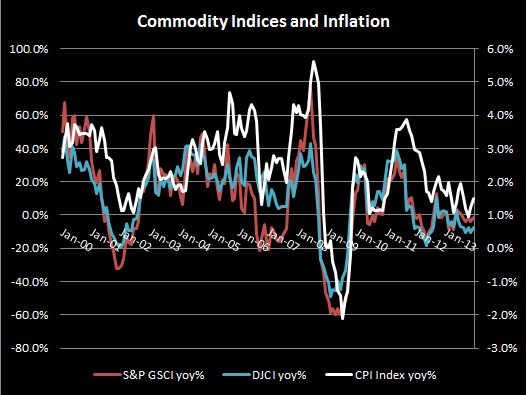
When using yoy% numbers back to Jan 2000, as far as historical data allows, the correlation between CPI yoy% and S&P GSCI yoy% equals 0.73 and the correlation between CPI yoy% and DJCI yoy% equals 0.69. Over shorter periods of time, including 10 years and 5 years from year end 2013, the correlation increases for both but more significantly for the S&P GSCI. The 10 year and 5 year correlation, respectively, with CPI yoy% for the S&P GSCI yoy% equals 0.77 and 0.84, and for the DJCI yoy% equals 0.70 and 0.72.
While there is a clear relationship between commodity index returns and inflation changes, what is even more interesting is how much inflation protection the commodity indices provide. For a very small allocation to commodity indices, the inflation protection benefit has been relativelively large. We measure this using a concept called inflation beta, which is a measure of sensitivity of commodity index returns to changes of inflation. It is similar to equity beta, where for example, if a stock moves up and down with the S&P 500 and is more volatile than the S&P 500, the beta is greater than 1. Inflation beta uses CPI as the benchmark rather than the S&P 500. Please see the table below for the inflation beta of commodity indices:
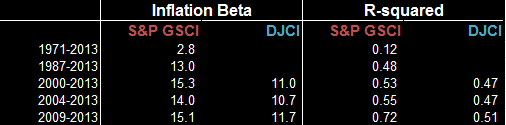
Since food and energy typically represent a higher percentage of commodity indices than of the CPI, one dollar of investment in a commodity index provides a basis for more than one dollar’s worth of inflation protection. In this chart, the inflation beta can be interpreted as a 1% increase in inflation results in 11.0% increase in return of the DJCI and a 15.3% increase in return of the S&P GSCI during the period from 2000 through 2013.
Notice the S&P GSCI increase in inflation beta of the S&P GSCI from 2.8 to 13.0 in the time period that starts in 1971 versus the time period starting in 1987. This increase is directly from the addition of oil into the index and is no surprise since energy is the most volatile component of CPI and energy is used to produce every other commodity. The world production weighting scheme of the S&P GSCI that yields a higher energy weight results in a greater inflation beta than the DJCI, though the inflation betas of over 10.0 from the DJCI are significant.
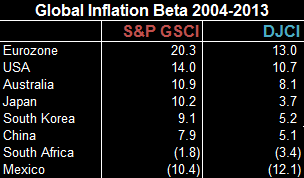
This also holds true for inflation betas around the world, except in places where the prices are independent of the economy. For example, the Mexican government sets the price of gasoline so returns of commodity indices are not considered an inflation hedge against changes in Mexican CPI. This is shown in the chart below:
Overall, from the analysis, both the S&P GSCI and the DJCI are strong inflation protectors. However, the S&P GSCI is a stronger inflation hedging tool given its energy weight.
The posts on this blog are opinions, not advice. Please read our Disclaimers.


