Get Indexology® Blog updates via email.

In This List

Why Indices Matter to SMSF Trustees

The Effects of U.S. Regulation on the S&P GSCI Biofuel

Starting on the Right Foot: Preparing Accurate ESG Disclosures

Performance Analysis of Liquidated Funds in Brazil

Here's How A Rising Dollar Impacts Stocks

Why Indices Matter to SMSF Trustees

Contributor Image
Stuart Magrath

Former Senior Director, Channel Management, Australia and New Zealand

S&P Dow Jones Indices

I spent a recent weekend at the Self-Managed Superannuation Fund (SMSF) Expo talking to SMSF trustees about indices. While I often spend Monday through Friday talking indices, to spend Saturday and Sunday chatting about indices was something new. The SMSF Association hosted the first SMSF Expo in Australia, attracting over 1,500 people over the three-day Expo. SMSFs represent about one-third (or AUD 721 billion) of Australia’s total superannuation asset pool of AUD 2.3 trillion, as of Dec. 31 2017.[1] These funds enjoy much greater flexibility in terms of investment choices, including the ability to borrow and leverage. There are over 1.24 million SMSF trustees in Australia.

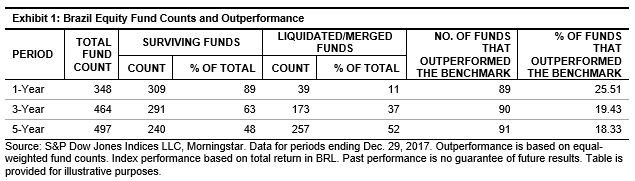
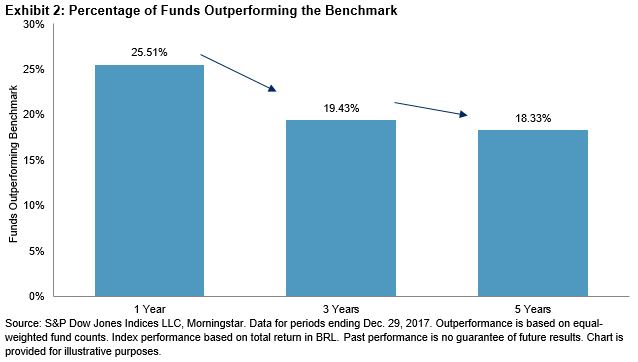
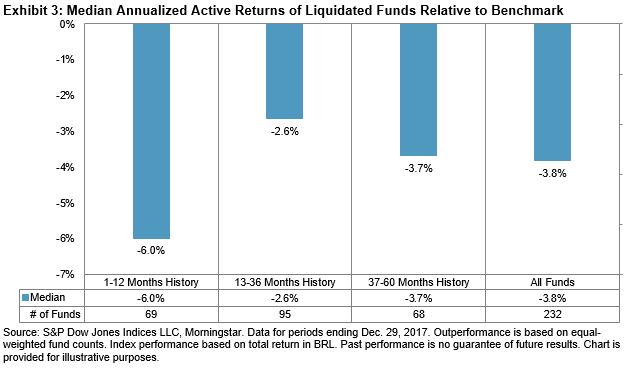
The most common question asked of me at the Expo was, “What does S&P Dow Jones Indices offer to SMSF Trustees?” My answer was that we primarily give away education, and from that point, I launched into sharing the findings from our SPIVA® Australia Year-End 2017 Scorecard, as well as the findings from the Persistence of Australian Active Funds: March 2018. With SPIVA, I always find it helpful to start with the infographic that shows the SPIVA phenomenon is not just something that occurs in Australia, but that in many markets, active managers find it hard to outperform their respective benchmarks.

After sharing the SPIVA and persistence findings, it was an easy segue to handing a trustee the ticker sheet of all ETFs in Australia and New Zealand that track an S&P DJI index. Armed with the research and ticker sheets, trustees who had not as yet invested in ETFs were then in a position to consider how these vehicles could form part of their portfolios.

But it wasn’t only SMSF trustees who attended the Expo. There were also financial advisers, many of whom are converts to the ETF cause, but had never met anyone from an index provider and were thrilled to know that there are myriad resources available to share with clients. It’s always satisfying to talk to advisers and trustees who advocate passive investing, but the real thrill at events of this nature is when you are explaining passive investing and indexing, sharing SPIVA or persistence results, and you see the dawn of realization on the faces of the people you are speaking with as they get why passive investing is growing and how easy it is for them to access passive investment vehicles.

[1]   Source: APRA, Quarterly Superannuation Performance December 2017

The posts on this blog are opinions, not advice. Please read our Disclaimers.

The Effects of U.S. Regulation on the S&P GSCI Biofuel

Contributor Image
Marya Alsati

Former Product Manager, Commodities, Home Prices, and Real Assets

S&P Dow Jones Indices

On July 9, 2007, S&P Dow Jones Indices launched the S&P GSCI Biofuel, which aims to provide market participants with a reliable and publicly available benchmark for investment performance in the feedstock commodities used in the production of biofuels. The index includes Chicago wheat, corn, soybean oil, and sugar.

Biofuels are produced utilizing biological processes, are renewable, and are intended to replace fossil fuels such as gasoline for transportation, which is not renewable. Biofuel was first used as fuel in a diesel engine in 1898. In 1918, blended gasoline was first invented and was used extensively during World Wars I and II due to oil shortages. The Clean Air Act was signed by Nixon in 1970, and in 1992, the Common Agricultural Policy allowed land to be designated for the planting of crops for biofuel production. In 2001, E15 (or 15% ethanol/85% oil fuel) was officially allowed in the U.S., and in 2007, President Bush signed the Energy Independence and Security Act, which mandated the increase of ethanol usage in the U.S. Exhibit 2 depicts the subsequent U.S. regulatory implementations as they related to the performance of the S&P GSCI Biofuel.

As seen in Exhibit 2, the S&P GSCI Biofuel tended to perform better during and subsequent to the implementation of new regulatory environments that supported the production and utilization of biofuel.

Exhibit 3 drills into the performance of the index during the month of May 2018, when U.S. President Donald Trump announced that he was considering allowing exported ethanol to count toward the volumes mandated under the nation’s biofuels law, a move that could benefit both the oil and corn industries in the U.S.[i]

The S&P GSCI Biofuel increased 0.9% on the day of the announcement (May 8, 2018), while the S&P GSCI Unleaded Gasoline declined by 1.1%.

Exhibit 4 depicts the annual correlation between the S&P GSCI Biofuel and the S&P GSCI Unleaded Gasoline. While the indices had a correlation of 0.2 for the entire period evaluated, the annual correlation levels fluctuated.

It can be seen that the correlation between the two indices was low or reflective of the entire period correlation during the “regulatory years” (2007, 2010, 2011, and 2018). The highest correlation levels were during 2008, when all commodity prices experienced a sharp downturn as a result of the credit crunch and sovereign debt crisis, and in 2016, when petroleum prices benefited from robust demand and biofuels strengthened as a result of increasing the Renewable Fuel Standard targets.[i]

[i]   Source: https://www.eia.gov/todayinenergy/detail.php?id=29132

[i]   Source: https://www.reuters.com/article/us-usa-trump-biofuels/trump-to-soon-propose-sweeping-changes-to-biofuel-laws-source-idUSKBN1IC263

The posts on this blog are opinions, not advice. Please read our Disclaimers.

Starting on the Right Foot: Preparing Accurate ESG Disclosures

Contributor Image
Erik Christianto

Business Development and Account Manager for Corporate Business

Trucost, part of S&P Global

As part of a series of articles on ESG disclosure, Trucost describes the importance of accurate ESG disclosure for reporters and readers.

By the time this blog is up, some seasoned ESG reporters in Southeast Asia will have published their sustainability reports; another group will be finalizing their reports; while the rest will still be in the process of preparing their disclosures. For the latter group, my advice to you is not to rush, start on the right foot, and prepare accurate disclosures.

Many first-time reporters are frustrated by the amount of new and sometimes unfamiliar ESG metrics they need to start monitoring. While some stock exchanges, such as SGX, HKEX, and Bursa Malaysia, have suggested specific materiality and reporting frameworks to streamline the process, many companies still struggle to understand and adopt the concepts. This often results in companies inadvertently publishing inaccurate data in their reports. In return, stakeholders who rely on these ESG data for decision-making suffer from misinformation.

In fact, inaccurate reporting also occurs among more seasoned reporters. Taking greenhouse gas (GHG) emissions disclosure for example, Trucost research found that, on average, 7% of companies underreport GHG emissions globally. If a power producer in Singapore affected by the new carbon tax made the same mistake, the investment community could be misinformed about the company’s financial exposure.

An accurate disclosure reflects well on a company’s governance, such as the internal data collection and reporting system that is in place. Plus, with an accurate disclosure, companies can confidently make important business decisions based on the information gathered. For example, a company can develop a reliable benchmark and establish quantifiable targets.

For readers of the sustainability report, such as investors, shareholders, and regulators, an accurate disclosure allows them to fairly assess the company’s performance. Investors and shareholders can draw trends, make their own analyses, and inform capital allocation decisions. According to the Global Sustainable Investment Review 2016, more than a quarter of all professionally managed assets were managed under responsible investment strategies, an increase of 25% since 2014. Finally, regulators can also rely on the information to set a country-wide target or policy.

As an ESG analytics firm, Trucost integrates reporters’ sustainability information into our research to develop essential intelligence for businesses such as investors, asset managers, and corporates.

How Can Companies Report Accurate Data?

Companies can ensure that they report accurately by always asking whether their data is representative and reliable: Can I rely on this data? Can I make business decisions based on this data?

One of the ways Trucost can help companies achieve this is by adopting a consistent reporting methodology based on best practice guidelines and standards.

Selecting a consistent reporting or accounting methodology is also important because many ESG metrics are derived information, with multiple acceptable reporting methodologies. The WRI/GHG Protocol, for example, accepts four different accounting methods to estimate Scope 3 GHG emissions from purchased goods and services. Another example is the injury frequency rate, for which there are two acceptable formulae: rate of occurrences of injuries can be measured over a period of 1 million working hours (Singapore/UK[1]) or over 200,000 working hours (U.S.[2]) These methodologies also provide guidance to reporters on data collection and advice on alternative approaches when preferred primary data is not available. Hence, consistency adopting a reporting methodology can ensure not only accuracy but also comparability of data.

Preparing an ESG or sustainability report for the first time is not easy. It requires time, investment, and resources to establish a solid foundation. However, if companies can start on the right foot and ensure the right information is collected, both companies and readers stand to benefit from the accurate reporting.

[1] Source: Health and Safety Executive

[2] Source: United States Department of Labor

The posts on this blog are opinions, not advice. Please read our Disclaimers.

Performance Analysis of Liquidated Funds in Brazil

Contributor Image
Karina Tjin

Former Analyst, Strategy Indices

S&P Dow Jones Indices

Since 2015, S&P Dow Jones Indices has been reporting on the performance of actively managed equity funds in Brazil through the S&P Indices Versus Active (SPIVA®) Latin America Scorecard. Aside from the performance of the funds, we observed that a significant number of Brazilian equity funds have liquidated or merged within the past five years. Funds can close for a variety of reasons, such as high operational costs, new legislation, underperformance, etc., and when they do, they liquidate their assets, or rarely, merge with another fund. In this blog, we examine the performance of these now-closed funds while they were active to determine if underperformance was a potential cause for fund liquidation.

Using the Brazilian Equity Funds category data and based on the SPIVA Year-End 2017 Latin America Scorecard, we grouped the funds by one-, three-, and five-year periods. Exhibit 1 combines data from Reports 1 (Outperformance) and 2 (Survivorship) of the scorecard and treats liquidated and merged funds as underperforming the benchmark, since they don’t have full performance history for the respective lookback period. The treatment ensured that survivorship bias of the fund universe was eliminated. If dead funds were excluded from the analysis, there would be an upward bias in the percentage of funds beating the benchmark, since poor performance could be the cause for funds to be shut down.

We first look at the fund counts for each period—over 37% of funds closed down within the three-year period, and more than half of the entire category was liquidated or merged within the five-year period. We also show the count and percentage of funds that outperformed the S&P Brazil BMI—the majority of funds underperformed the benchmark in all three periods. In addition, the percentage of funds that outperformed the benchmark decreased over the longer time horizons (see Exhibit 2).

To determine if underperformance was  the likely driver of the funds closing down, we compared the performance of the dead funds with the S&P Brazil BMI for the period that they were active. The measurement period for each fund was based on the lookback period start date (December 2012), or on the fund start date if it was more recent, and the full month prior to the fund’s closure. To be included in the analysis, the funds had to have data for the full period, or up to one month prior to closure. The one-month buffer enabled a larger number of funds to be analyzed. Funds without performance data or with significantly less available data than anticipated were excluded from the analysis. For the remaining funds, we calculated the annualized return of the fund and the benchmark for each fund’s measurement period.

Exhibit 3 compares the median returns of the closed-down funds relative to the S&P Brazil BMI. The funds were grouped by the number of months measured: 1-12 months, 13-36 months, and 37-60 months. As a note, while funds were grouped by measurement period length, the actual dates measured would be different for each fund.

As a group, liquidated funds underperformed the benchmark by a meaningful amount, regardless of the measurement period length. Overall, the median liquidated fund underperformed the benchmark by 3.8% per year. The performance of these funds was considerably lower than the five-year median annualized active return of -1.64% reported for the category in the SPIVA Year-End 2017 Latin America Scorecard.[i] The performance differential between liquidated funds and surviving funds helped us to confirm two things: 1) that performance was a likely driver in fund closures, and 2) the underperformance assumption used in SPIVA Latin America Scorecards for liquidated funds is a valid approach. In a follow-up blog, we will look at the potential impact of survivorship bias on the outperformance figures in the SPIVA Latin America Scorecard.

[i]   The five-year second quartile return of the Brazil Equity category was 5.34%, as shown in Report 5 in the SPIVA Year-End 2017 Latin America Scorecard. For the same time period, the S&P Brazil BMI returned 6.98% (see Report 3 or 4), leading to the underperformance figure of -1.64%.

The posts on this blog are opinions, not advice. Please read our Disclaimers.

Here's How A Rising Dollar Impacts Stocks

Contributor Image
Jodie Gunzberg

Former Managing Director, Head of U.S. Equities

S&P Dow Jones Indices

The U.S. dollar hit a 4 month high last week from concern over potentially faster interest rate hikes to control inflation as oil exceeded $70 per barrel and the lowest unemployment since 2000 was reported.  If the U.S. dollar continues to strengthen, it may be useful to know how U.S. equities moved historically in times when the dollar rose.  Given each size, style and sector has different exposures to the U.S. dollar, there have been differences in the performance of each.

Naturally the largest companies do most international business so have a greater portion of revenues coming from outside of the U.S.  Notice in the table below from S&P Dow Jones Indices research that the S&P 500 has 70.9% of revenue from the U.S.  That is less than the 73.3% of U.S. revenue in the S&P MidCap 400 but is much less than the 78.8% of U.S. revenue generated in the S&P SmallCap 600.  

Also, in a recent S&P Dow Jones Indices research paper, an analysis showed the percentage of revenues from the U.S. by sector.  For illustrative purposes, two methods were used to measure the percentage of U.S. revenues, and the results were relatively in line for each method.  Energy showed the most difference between the methods since the three biggest companies in that sector contributed heavily to the overall revenues.  Notice the real estate, telecom and utilities sectors have the highest percentage of revenues domestically. 

Therefore these sectors underperformed in the period measured in the aforementioned paper that was from Nov. 8, 2016 – Dec. 29, 2017, when the U.S. dollar fell roughly 7%.  Likewise, during this period, the technology and materials sectors that have the greatest percentage of revenues coming from overseas, outperformed significantly.  

While the percentage of revenues breakdown by the U.S. and international matters for performance as the dollar fluctuates, in some cases, the companies hedge or partially hedge currency moves, so the currency impact is muted.  Further, there are other factors that may drive outperformance more than the dollar moves. For example, the energy sector underperformed with a falling dollar and rising oil prices, despite having relatively low revenues from the U.S., since many companies hedge against oil price moves to reduce volatility of revenues.

An interesting finding when comparing the impact on U.S. equities from a falling dollar versus a rising dollar is that the sensitivity to the falling dollar is much greater, though the U.S. equities rise on average in either case.  This is much in-line with findings that U.S. equities have historically risen more with interest rate cuts than with hikes, but that with growth, equities can still rise with rates.

On average, the S&P 500 rises 3.7 times more from a falling dollar than a rising one, perhaps since a falling dollar helps the international business, and companies can hedge portions of their international revenues if the dollar rises.  The S&P MidCap 400 is 3.9 times more sensitive to a falling dollar than rising one since a falling dollar gives the mid-size companies a chance to grow international business when the dollar falls.  The mid caps also performed best with the falling dollar. The S&P SmallCap 600 is 3.1 times more sensitive to the falling dollar than a rising one but does better than large- or mid-size companies when the dollar rises.  

On a sector level, materials, financials and energy are all driven more by a falling dollar than a rising one, though energy and materials actually fall with a rising dollar.  This is since the underlying commodities are priced in dollars so the dollar is a powerful driver of these sectors; however, the downside capture ratio when the dollar falls is much greater than the (small negative) upside capture when the dollar rises, so the companies may be skillful at hedging their downside from falling prices of raw materials.  Also, the falling dollar helps the mid-size tech companies significantly more than a rising dollar.  This is since technology has a relatively large portion of revenues coming from outside the U.S. and the mid-size companies have extra room to expand before they mature.

Overall, the S&P SmallCap 600 benefits most from a rising dollar from its heavier U.S. revenue concentration.  On average, historically in the past ten years, for every 1% the dollar rose, small caps gained 95 basis points, mid-caps gained 82 basis points and large caps 71 basis points.  Small-caps in financials have outperformed their bigger counterparts with rising rates.  The financial large-caps have about 20% of their revenues internationally whereas the smaller banks are likely more local so do better (though aren’t that sensitive, rising just 26 basis points per 1% dollar increase) with a rising dollar and with rising rates, but when rates don’t rise, utilities have fared better.  The bottom line is that a rising dollar is not harmful for most stocks, especially small-caps; however, all else equal – energy is too sensitive to the downward pressure on oil with a strengthening dollar.

Source: S&P Dow Jones Indices

Endnote: Exhibits, 2, 10, and 11 were prepared by my colleague, Phillip Brzenk.  Exhibit 2 appeared in Brzenk, P. “How Global Are the S&P 500®, the S&P MidCap 400®, and the S&P SmallCap 600® Style Indices?”, S&P Dow Jones Indices, February 2018. Exhibits 10 and 11 are from Brzenk, P. “The Impact of the Global Economy on the S&P 500®”, S&P Dow Jones Indices, March 2018.

The posts on this blog are opinions, not advice. Please read our Disclaimers.