


In a prior post, we looked at the global exposure of the S&P 500. Given the large number of multi-national corporations based in the U.S., approximately 29% of S&P 500 revenues came from overseas in 2017. Beyond large-cap companies, do regional and country exposures change as investment style changes? In this blog, we add to the analysis performed on the S&P 500 and look at the differences in revenue exposure across the nine U.S. style boxes.
This analysis could potentially aid in understanding the differences between the indices beyond looking at size, fundamentals, or sector weights. We look at revenue exposure of the indices on a regional level, as well as on the country level. In addition, we review the total percentage of companies that are purely domestic in terms of revenue origination.
On a regional basis, the large caps have a higher level of geographic diversification compared to the smaller size segments. In addition, growth is more geographically diverse than value for large and mid caps, while the two styles have a similar level of revenue distribution in small caps. In particular, the revenue exposure to the Asia-Pacific region for growth is higher than the blend (overall benchmark) and value for both the S&P 500 and the S&P MidCap 400.
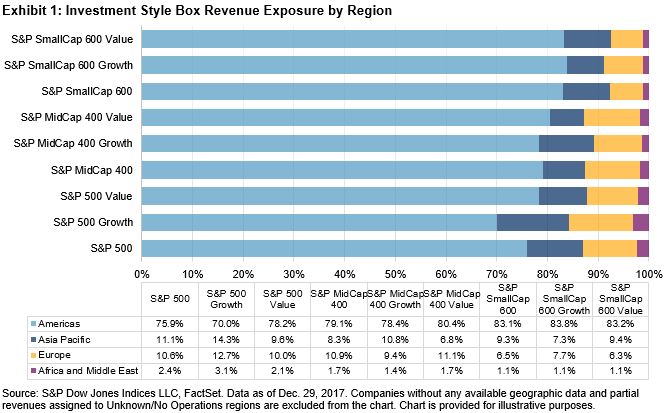
Small caps have the highest domestic exposure, at 79% of total sales, with mid caps sitting at 73%, and as mentioned previously, large caps at 71%. The trend of increasing U.S. exposure as one moves down the size scale is not surprising. Among other reasons, smaller companies are generally less mature and have less capital to grow their businesses internationally.
There is little differentiation in U.S. revenue exposure between growth and value for small- and mid-cap companies. However, in the large-cap space, growth (65% U.S. revenue) is more foreign-oriented than value (73% U.S. revenue) by a considerable amount. One driver of this is the relatively higher exposure that growth has to China at 5.6%, while value has an exposure of 3.8%.
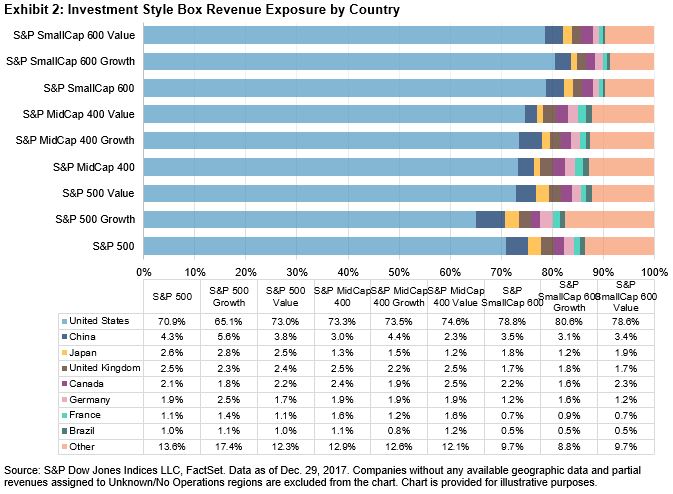
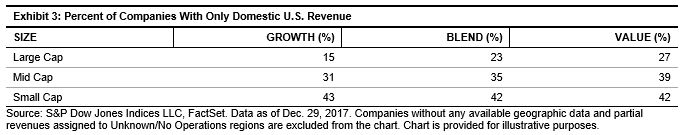
Exhibit 3 lists the percentage of companies that only have domestic U.S. sales for each investment style. Nearly 23% of companies in the S&P 500 only obtain revenues from the U.S., but that figure jumps to 35% for the S&P MidCap 400, and 42% for the S&P SmallCap 600.
In terms of percent of holdings, nearly double the amount of small-cap companies are purely domestic compared to large-cap companies. When comparing large-cap growth to small-cap growth, the difference is more pronounced. In the S&P 500 Growth, just 15% of companies get all sales from the U.S., whereas the figure stands at 43% for the S&P SmallCap 600 Growth. Overall, growth tends to include more geographically diversified companies, while value includes more purely domestic companies.
As we demonstrated, there are notable differences in the geographic sources of revenue among the domestic equity size and style indices. Further testing is required to establish whether cross-sectional differences in revenue origination explain return differences. However, at a minimum, market participants may need to keep in mind that certain market or economic events may affect a company or portfolio economically, and that impact could potentially be explained by where revenues come from geographically, and not just from its size (market-cap), fundamentals (growth/value), or line of business (sector/industry).
The posts on this blog are opinions, not advice. Please read our Disclaimers.


